Wind energy in the Irish power system.
Fred Udo
Abstract.
This article describes the influence of wind energy on the
CO2 output of
the fossil-fired generation of electricity in Ireland. Where most available
publications on this subject are based on models, the present study makes use
of real-time production data. It is shown, that in absence of hydro energy the CO2
production of the conventional generators increases with wind energy penetration.
The data shows that the reduction of CO2 emissions is at most a few
percent, if gas fired generation is used for balancing a 30% share of wind
energy.
1. Introduction.
The claims, that
large wind energy plants will be an important factor in the “green energy
transition” have never been substantiated by studies based on facts about
reduced CO2 emission or fossil fuel consumption. There is enough
reason for doubt, as wind energy is chaotic and its production is uncorrelated
with the demand for electricity, which follows a regular day/night pattern.
Wind electricity has priority over the conventional sources of electricity in most grids,
which means the other generators have to compensate for wind surges or ebbs, but
'No wind means no wind energy'.
As a consequence no fossil-fired plant has been closed after the recent large-scale build up of
wind energy in Europe.
Wind energy has become a multi-billion dollar business financed by large amounts of public
funds, despite the above-mentioned problems and uncertainties.
The interaction of wind energy with fossil-fired electricity generators could up till now only be
discussed with the help of models1, 2, 3, 4.
The reason is, that real-time operations data is kept away from the public.
On one occasion independent researchers got access to the real-time operations data. The result
is the Bentek study5
about the introduction of wind energy in the Colorado and Texas systems. The Bentek study
shows, that wind energy plays havoc in systems dominated by coal generation.
Model studies pleading the case of wind are among the Delft
group6 and others.
Semi-empirical studies of wind energy were performed by Post7
and Sharman8. Both authors
emphasise the disastrous financial consequences of large quantities of wind
energy and show, that above about 10% contribution of wind energy to the
electricity grid one
encounters a new phenomenon: curtailment. This occurs when demand is low and
the production of wind energy is high. In that case wind turbines have to
behave like any other supplier of electricity, namely to adjust the production to
the demand. Clearly this phenomenon affects the already poor efficiency of wind
turbines.
EirGrid, the Electricity Transmission Operator in Ireland, offers now the second opportunity after the
(Bentek) Colorado case to study the influence of wind energy on a conventional
generator system on the basis of real data. The Irish grid operator provides
real-time data about the total demand for electricity, the wind energy and
the CO2
emission on a Ľ hour basis. The website www.eirgrid.com
contains all this data from November 2010 to this day.
This present study analyses the empirical data of Eirgrid to show the effects of wind energy on the CO2
emission of a fossil-fired generator park, which is mainly based on gas.
The website of EirGrid does not provide detailed data about the use of hydro energy.
So hydro energy could not be
incorporated in this analysis.
After the
description of the Irish system and the data provided on the website in chapter
2, chapter 3 and 4 analyse the data of April and June 2011 in detail.
These periods are chosen
because of the near absence of hydro energy during those months.
2. Description of the data.
In 2010 the Irish electric grid used the following fuel mix:
Figure 1
.gif)
The installed capacity mix is: 6750 MW fossil, 1500
MW wind, 250 MW hydro.
The 7 GW of conventional capacity is only very partly used, as the average demand is
normally between 3 and 4 GW.
Notes:
- The “9,8% wind” is energy not installed capacity.
- During periods of low rainfall, hydro energy is minimal.
The Irish grid publishes the following system operating data:
- CO2 emissions,
- total electricity demand and
- wind energy production
The energy production of the other sources, such as hydro, can only be estimated from the monthly totals posted on the site of EirGrid.
The following is a direct quote from the site of
EirGrid:
“EirGrid, with the support of the Sustainable Energy Authority of
Ireland, has developed together the following methodology for calculating CO2
Emissions.
The rate of carbon emissions is calculated in real time by using the generators MW output,
the individual heat rate curves for each power station and the calorific values for each type of
fuel used. The heat rate curves are used to determine the efficiency at which a generator burns
fuel at any given time.
The fuel calorific values are then
used to calculate the rate of carbon emissions for the fuel being burned by the
generator“
Note 1:
The heat rate degradation due to ramping down the
fossil-fired plants with wind energy surges and ramping up with wind energy
ebbings is not accounted for in the calculations of EirGrid. This means the
CO2 emissions posted on the site are understated.
Note 2:
The total CO2 emissions are presented in tons.
The specific emissions of fossil
burning are called the CO2 intensity.
The CO2 intensity
is expressed in g/kWh.
Table 1 presents an overview of the data.
| Month | Demand GWh |
Wind+hydro GWh |
Wind GWh |
Wind % |
Hydro GWh |
|---|---|---|---|---|---|
| Nov. 2010 Dec. 2010 Jan. 2011 Feb. March April May June July August |
2324 2555 2434 2188 2241 2027 1913 1970 1913 1935 |
400 270 354 443 256 256 551 259 200 204 |
298 216 248 369 183 241 510 232 173 182 |
13,3 8,5 10,2 16,9 8,2 11,9 26,7 11,8 9,2 9,4 |
102 54 106 74 73 15 41 27 27 22 |
It appears, that
the drought in the first half of the year 2011 has adversely affected the use
of hydropower in the months April to June 2011. This enables us to study the
CO2 emissions in absence of hydro power.
The utilisation of the pumped hydropower station during 2011 is affected by a renovation of the installations.
3. Analysis of the June 2011 period.
The wind energy production was 232 GWh, the sum of the 1/4-hour data.
The wind energy contribution was 232/1970 = 11,8% in this month.
Figure 2 shows the time correlation between CO2 intensity as g/kWh and the wind energy penetration as % of the total demand.
The CO2intensity is divided by 10 in order to fit the two lines on one scale.
Figure 2
.gif)
The horizontal scale represents the 30 days in June subdivided into 1/4-hour
periods.
The graph shows some correlation between wind energy and CO2
emissions.
The CO2
intensities shown above include wind and hydro energy.
The next step is to subtract the wind energy from the total demand and recalculate the CO2intensities (CO2conv) due to the conventional generators. This also should be done for the hydro energy but the 1/4-hour data are not posted. However, the hydro energy influence may be ignored for this month, as it is only 0,8% of the total energy demand. See Table 1.
During a day the wind per cent contribution changes because of variation of the wind, but also
because of the daily variation in demand. This implies that wind penetration
can be defined for every 1/4 hour as the wind energy divided by the total electricity
demand.
A scatter diagram is best suited to investigate the correlation between the
CO2production
and the wind penetration: figure 3.
Figure 3
.gif)
The data at low
wind penetration shows, that the fuel mix has been switched from gas to
coal/peat several times during this month. Subdivision of the data in smaller
periods gives a better impression of the correlation.
Figures 4 and 5
show the first 10 days of the month.
Figure 4
.gif)
Figure 5
.gif)
The trend of increasing CO2 emission with increasing windpenetration (=% contribution to electricity generation) becomes clear. The data behaves very different from period to period, so quantitative conclusions cannot be drawn from the June data.
4. Analysis of the April 2011 data.
The April data are even better suited for investigating the influence of wind power on a conventional system without storage, because the contribution of hydropower was only 0,7% that month (see table 1). The contribution of wind to the total electricity production is 12,4% in April. This amount is a little higher than the year average of 9,8% wind energy. Figure 6 gives the time diagram of the total demand and the total wind production.
Figure 6
.gif)
Wind penetration is defined as the windproduction (the red line) divided by the
total demand (the blue line in the same graph). This quantity is calculated for
every quarter of an hour.
Figure 7 shows the intensity of the fossil-fired plants as a function of
the wind penetration for the whole month of April.
Figure 7
.gif)
This diagram shows
a clear correlation between CO2 intensity and wind
contribution. The CO2
intensity varies between 300 and 600 g/kWh at low wind contributions. This variation
in CO2
intensity indicates, that during the month different configurations of the
available generators have been used.
The fit equation shows, that in the absence of wind the CO2
intensity is 436 g/kWh.
The CO2 intensity averaged over April is 418
g/kWh. This number is directly extracted from the EirGrid data.
The net effect of 12,4% wind is a decrease of the CO2 intensity
from 436 to 418 g/kWh in April. Twelve per cent wind causes a
reduction of the CO2 emission by 4%. The CO2 reduction
is one third of the reduction expected for this share of wind energy.
This conclusion
can be refined by splitting the month into periods of one or two days, as the
utilisation of the fossil fired generators will not drastically be altered
within such a short time span.
The first week had
a wind energy contribution of 28% and one had to use mainly gas as backup.
This statement is based on the results of the subsequent analysis. Figure 8 shows the
CO2 intensity from the fossil-fired plants for the first two days in
April.
Figure 8
.gif)
The average CO2
intensity from the data in figure 8 is 547 g/kWh. The contribution
from wind is 28%, so the CO2 intensity calculated over fossil plus
wind is 547x(1 - 0,28) = 394 g/kWh.
The fit tells us,
that without wind the production of CO2 would be 398 g/kWh.
The effect of 28% wind power is a decrease of the emission from 398 to 394 g/kWh. (-1%)
The next two days show an even higher share of wind: 34%.
Figure 9
.gif)
The average CO2
intensity calculated from the data in figure 9 is 591 g/kWh.
The wind contribution is 34%, so the CO2 intensity calculated over fossil
plus wind is: 591x(1 – 0,34)= 390 g/kWh.
The fit equation shows, that the CO2 intensity without wind turbines
is 414 g/kWh.
The presence of 34% wind
power has decreased the CO2 emission
from 414 to 390 g/kWh. (-6%)
Figure 10
.gif)
The average CO2 intensity calculated from the
data points in figure 10 is 551 g/kWh.
The wind contribution is 30%, so the CO2 intensity
calculated over fossil plus wind is: 551x(1 – 0,30) = 386 g/kWh.
We obtain from the fit at x = 0: 398 g/kWh.
The presence of 30% wind power has decreased the CO2 emission
from 398 to 386 g/kWh. (-3,0%)
It has to be stressed, that these minuscule decreases
in CO2 emission or fuel usage are calculated for the
entire system of Eirgrid in April 2011.
During the first
days of the month large variations in wind energy occurred and the operators
counteracted this by using mainly gas as a backup. This can be inferred from
the fits, which point to about 400 g/kWh for zero wind. This is a normal figure
for generators based on gas turbines.
5. The period from november 2010 to August 2011
The analysis as described above has been applied to all data available on eirgrid.com. The results are presented in table 2.
| Month | Wind (%) |
CO2avg. g/kWh |
zerowind g/kWh |
CO2conv g/kWh |
Reduction (%) | Wind eff (%) |
|---|---|---|---|---|---|---|
| Nov. 2010 Dec. 2010 Jan. 2011 Feb. March April May June July August |
13,3 8,5 10,2 17 8,2 11,9 26,7 11,9 9,2 9,4 |
475 481 433 426 513 418 381 436 488 462 |
528 525 478 495 536 436 445 484 537 486 |
549 529 486 510 562 477 517 498 537 516 |
10 8 9 14 4,6 4 14 10 9 4,9 |
75 95 88 83 56 34 53 84 98 52 |
| Average | 12,6 | 451,3 | 495 | 518,1 | 8,9 | 70 |
The three columns are all three CO2 intensities.
"CO2avg" is the emission as given by the EirGrid tables.
"Zero wind" means
CO2 emissions extrapolated from the correlation diagrams to zero wind
contribution.
"CO2conv" is the emission of the conventional generators under the influence
of wind.
The "wind efficiency" is defined as the reduction of CO2 emission in % divided
by the amount of wind in %. The reduction for November is calculated as (528 - 475) / 528 = 10%.
The time sequence of this number looks as follows (fig. 11).
Figure 11
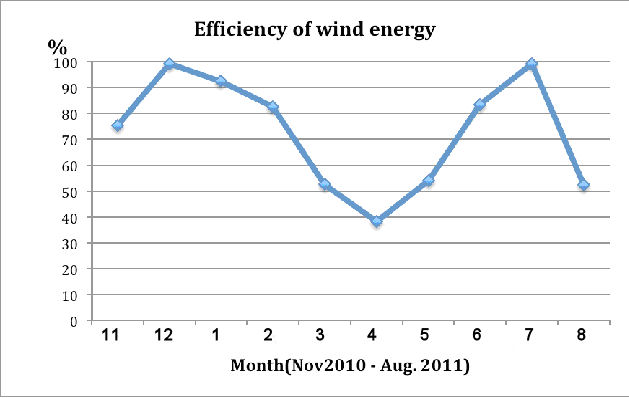
There are 4 months with a particularly low wind efficiency: March, April, May and August.
Three out of four have a low contribution of hydro energy and fall in the dry period of the year.
The average CO2 emissions of the Irish power system for 2009 was 553 g/kWh.
This is considerably higher than the number derived from the tabular data: 451 g/kWh is the average
emission calculated directly from the tables of Eirgrid.
6. Conclusions and remarks.
The availability of very detailed data series in Ireland on wind contribution,
electricity demand and the CO2 emission figures (calculated
as a function of static heat rates of the power stations) has finally enabled a facts based analysis of
the maximal emission and fuel saving effected by wind generated electricity.
Unfortunately the role of hydro energy could not be isolated from the data.
Currently the combination of wind energy with gas
turbines is seen as the ideal configuration to deal with the problem of the
fluctuations of wind energy.
The April data of the Irish electricity system shows
clearly, that the combination of wind energy with gas turbines does not achieve the goal
of CO2 emission reduction,
if no storage of energy is present.
In general it is shown that the CO2 saving decreases with increasing
wind contribution to the electricity supply.
The consequence is that an investment of billions of
Euros in wind turbines produces
not more than a few per cent reduction in CO2 output.
This analysis does not take into account the energy
necessary to ramp the conventional generators up and down nor the energy to
build windturbines nor the extra transmission lines with their additional
losses.
It is highly probable, that taking al these effects
into account will show, that the few per cent gain in CO2
will revert to a loss (i.e. an increase in CO2).
The Irish system performs slightly better in other
months probably due to the greater contribution of hydropower, but it never
comes near to the promises made by wind energy advocates.
This study shows, that building wind turbines without constructing adequate storage
of energy is futile. It only leads to high extra costs and hardly any fuel or emission saving.
Therefore, the introduction of wind energy without buffer storage leads to increased
fossil fuel use and CO2 emissions and is a non-sustainable practice.
Acknowledgements
Thanks are due to Hugh Sharman who suggested the use
of correlation diagrams to analyse the data and Willem Post who
kindly helped editing of the text.
Monnickendam, August 29, 2011.
Last revison October 16, 2011.
E-mail: Fred Udo
References.
-
Kent Hawkins: Wind Integration Realities: Case Studies of the Netherlands and of Colorado.
(http://www.masterresource.org/2010/05/wind-integration-realities-part-i) -
C. le Pair & K. de Groot: The impact of wind generated electricity on fossil fuel consumption.
(http://www.clepair.net/wind-SPIL-2.html) -
F. Udo, K. de Groot & C. le Pair: The impact of wind generated electricity on fossil fuel consumption.
(http://www.clepair.net/windstroom%20e.html") -
Kent Hawkins: Peeling away the onion of Denmark Wind and many other articles in:
(http://www.masterresource.org/2010/05/wind-integration-realities-part-i/#more-9977) -
Bentek Corporation: How less became more; Power and Unintended Consequences in the Colorado Energy Market.
-
B. Ummels: Wind Integration; Thesis Delft 2009.
(http://www.uwig.org/Ummels_PhDThesis.pdf) -
W. Post: Wind Power and CO2 emissions.
(http://theenergycollective.com/willem-post/57905/wind-power-and-CO2-emissions) -
Hugh Sharman: Wind energy, the case of Denmark.
(http://www.cepos.dk/fileadmin/user_upload/Arkiv/PDF/Wind_energy_-_the_case_of_Denmark.pdf)

![]()