
The impact of wind generated electricity on fossil fuel consumption.
by
C. le Pair & K. de Groot
clepair@casema.nl
kenjdegroot@mac.com
Abstract
Wind turbines produce electricity which is delivered to the
grid. Variations in wind velocity cause yield variations. Conventional power
stations are forced to compensate these variations by adjusting their output.
This has a negative effect on the efficiency of the latter stations. Using data
provided by CBS, the Dutch Institute for Statistics, an estimate is made of the
so called “turning point”. This is the point where the efficiency reduction of
conventional power stations balances out the fuel saving of the wind turbines,
and where the CO2 emission reduction turns negative as well. In the
Netherlands the data for the year 2007 show this to be the case at an
efficiency reduction of all power stations of about 2 %. The Dutch government uses an incorrect
formula for calculating the fuel and emission saving from wind energy. On this
subject parliament has been incorrectly advised by government.
In addition, fuel costs required for
initial installation of wind turbines are substantial.
Application of wind energy without
adequate buffer and storage facilities serves no green purpose.
Introduction
In a previous article1 we
calculated the negative effect on the fossil fuel saving obtained when using
wind generated electricity. The effect is caused by the stochastic nature of
wind availability, which requires frequent and rapid output adjustments of the
fossil fuel powered plants. In our sums we used German data, because wind
turbines have been erected there in large quantities. We also used
somewhat too high estimates of the
efficiency of fossil fuel power stations.
We now turn our attention to the Dutch
situation, where thanks to our CBS, the National Bureau of Statistics, actual
data on the fuel input and electricity output of various kinds of power
stations are available.
Coupling wind farms to the electrical power
grid requires additional output adjustments of the other power stations to allow
for wind fluctuations. We will call these other power stations “conventional
producers”. Without wind farms these producers would provide an amount of
electricity E according to demand. This would in turn require an amount F of
fossil fuel. The efficiency is then equal to
| R = E/F | (1) |
The Dutch government2 and public conclude that the fossil fuel saved ΔF can be related to the efficiency and the total fossil fuel use of the system as follows:
| F - ΔF = ( E - Ew) / R | (2) |
The amount of fossil fuel used in a situation where wind is providing electricity as well thus becomes:
| F - ΔF = ( E - Ew) / ( R - ΔR ) | (3) |
| ΔF = F - ( E - Ew) / ( R - ΔR ) | (4) |
When combining equations (1) and (4) for ΔF = 0 we find:
| E/R= ( E-Ew) / ( R- ΔR ) |
| ΔR = Ew*R/E | (5) |
Generally the following equation holds for the efficiency loss at the turning point:
| (ΔF = 0 if) ΔR = aR | (6) |
| a = Ew/E, | (6a) |
Reality
Does
an efficiency loss of this magnitude
actually occur? We were unable to find data on this effect. In our earlier
article we called this “ a well-kept secret”. We did receive promises from researchers
that they would try and send us
the relevant information. So far, we have not received data. Electricity
producers, apart from EPZ(Zeeland), have not provided us with the information.
Again, we have received promises that this will be subject of study.
F. Udo3 has made estimates on the basis of performance data of various generating
units. These estimates show negligible overall fuel and emission savings during
wind farm operations. He also focusses on the technical (in)ability to fit in
the wind generators in the overall system.
B. Chr. Ummels sees no difficulty for this fitting in of wind power, even when the
Dutch wind generating capacity would be 12 GW (Ph. D. thesis4 Delft
University). Udo shows however, that according to Ummels' own calculations (in
his figure 2.12, ibid.) either the conventional power stations or the wind
farms have to be switched off for about half of the time. This of course
destroys the security of electricity delivery. Udo estimates the average
efficiency of the Dutch conventional power stations to be 50%. The actual
figure for the year 2007 is about 43,5% (see below). Comparing these two
figures gives an indication of the effect of running below peak efficiency or
at variable load. An efficiency loss of
about 2% caused by fluctuating wind supply is therefore not unreasonable at
all. The effect of such efficiency loss is, however, that no fuel or emission
reduction occurs at all.
J.Soens5 calculates – in the same way as done by Ummels
that for the Belgian situation a maximum wind
contribution can only be 700 MW (17 times less than Ummels' goal) to reach the
point beyond which adding wind farms becomes counterproductive.
In the spring of 2009 a Delft group published a
report6 in which the efficiency loss due to wind power addition to the grid was mentioned,
but not quantified.
Kent Hawkins7 recently published a study of the technical characteristics
of gas powered electricity generators, which are used for back-up of other
units. He concluded : “The general conclusion is clear:
industrial wind power does not produce the claimed benefits of reductions in
fossil fuel consumption and CO2 emissions when up-and-down backup generation
inefficiencies are taken into account.”
W. Katzenstein and Jay Apt8 address
the emission of CO2 and other gases as a result of rapid output
change of natural gas fired generators. As far as we can make out, their study
does not consider the effect of having to replace the slowly reacting, but
efficient generator systems (efficiencies up to 58%) by the quickly responding
but inefficient (about 30%) gas turbines. Nevertheless, they find that the quick
ramping up and down of the gas turbines leads to a reduced (75-80%) emission
saving compared to the one expected when this effect is not taken into account.
We note that CO2 emission is roughly proportional to natural gas
consumption.
The Dutch Ministers of Economic Affairs and of
the Environment replied to questions
in Parliament on February 10 2010 on this issue. Their answer contains the
following passage: “ When wind electricity is supplied, conventional power
stations will step down their power, and also use less fuel and emit less CO2,
to allow for the use of wind electricity”. They also state that, on the basis
of “verified” numbers, a reduction in output by 1/3 leads to 31,6% less CO2
emission. They have not indicated how these figures were verified. That is impossible anyway, because in the
report from the Delft group, that they quote6, this information is not
provided. A simple model calculation for an existing modern, rapidly responding
combined cycle power station of known performance characteristics shows that an
output reduction of such magnitude causes an efficiency decrease from 55% to
40%. In that case the fuel saving is about zero, as is the CO2
emission reduction. The Dutch parliament has thus been informed incorrectly.
May be members of parliament should directly contact the Delft group.
(New questions by MP De Mos, were answered in March. The ministry sticks to its
wrong arithmatic. It does recognize the occurrence of efficiency losses14.)
People and organizations go a long way in
defending wind farms. NUON, a Dutch electricity provider running an offshore
wind farm, renovated a number of old (inefficient) gas-fired power units to
cope with the rapid wind variations and its consequences for the electricity
supply8. Udo (op. cit.) provides an interesting analysis of the
resulting effects. Anyway, one keeps stations in operation with low efficiency
and thus high fuel use and emissions rather than reducing fossil fuel use and
emissions by upgrading to more efficient units.
The Netherlands
The Netherlands uses various power sources for electricity generation. Most use fossil fuel. The share of each power type is presented in table 1.
| Data CBS Statline 200710 | ||||
|---|---|---|---|---|
| type |
Ei [GWyr] |
Fi [GWyr] |
Ri | |
| power plants | 8,04 | 18,45 | 43,6% | |
| other producers | 3,97 | 12,99 | 30,5% | |
| nuclear | 0,48 | ~ 0 | n.v.t. | |
| power plants excl.nuclear | 7,56 | 18,45 | 41,0% | |
| sustainable | 0,87 | |||
| grid losses | 0,53 | |||
| wind | 0,39 | |||
| nett import-export | 2,01 | |||
|
Tot. central combined heat/elec
+decentral ditto |
8,04 | 18,45 | 43,6% | |
|
tot.centr.combined
heat/electr. |
3,23 | 7,48 | 43,2% | |
| tot.centr. not combined | 4,81 | 10,97 | 43,8% | |
| total supply | 14,02 | |||
| total production | 12,01 | |||
| nett import-export | 2,01 | |||
|
total decentralized
combined h/e+non combined |
3,97 | 12,99 | 30,6% | |
|
total decentral
combined h/e |
3,38 | 12,28 | 27,5% | |
|
totaal decentral
non combined h/e |
0,59 | 0,71 | 83,0% (?) | |
|
In the table, the symbols Ei , Fi and Ri refer to, respectively, the produced electricity, fuel used and resulting efficiency for the particular source. We use the most recent year for which almost all values have been verified (and/or 'corrected') by CBS. The numbers for the year 2007 refer to the situation with wind generation “fitted in”. Ei, Fi and Ri are not all the same quantities as used in the formulae (1) to (6a). In these formulae E and F are the assumed electricity production and the accompanying fuel use, in case no wind turbines would have been connected to the grid. |
Some electricity providers in the Netherlands
also supply (waste) heat for space heating and the process industry. We have
assumed that this heat supply is driven by the demand for electricity, thus not
requiring additional capacity variations in the electrical power generation.
This does not apply to decentralized combined heat and power generation. Those
systems are in most cases driven by the heat demand. Without further specific
data one cannot decide whether this generating capacity can be varied in
response to rapid variations in electricity demand (or supply from other
sources). The table also shows data on import and export of electricity. We do
not know the degree to which this electricity import into and export from the
Netherlands is controlled or
controllable by rapid demand fluctuations inside the country, just by price
differentials or by any other factor.
The CBS data are generally in line with our own
gross estimatess. We are unsure, however,
about the fossil fuel use of small scale
combined heat and power generators. Are such systems also relying on non-fossil
fuel? However, because the contribution of these small generators to the
overall system is modest, this has a limited effect on the uncertainty in our
results below.
We will calculate the efficiency effect for various assumptions. We want to determine the efficiency loss caused by the wind supply fluctuations at the point where the fuel saved by the wind is equal to the fuel lost by the efficiency reduction of the back up system. In other words, the point where ΔF = 0. At this point the fuel consumption F from formulae (1) to (5) above is obviously equal to the fuel figures given by CBS. However, for the generated electricity E we need to add to Ei the electricity generated by the wind (0,39 Gwyr, from table 1), unless the figure already includes the wind contribution. In the first case we get:
| Efficiency & efficiency decrease at the turning point | |||||
|---|---|---|---|---|---|
| for |
Ei [GWyr] |
E [GWyr] |
F [GWyr] |
R | ΔR |
| total supply | 14,02 | 14,02 | 31,44 | 44,60% | 1,24% |
| national production | 12,01 | 12,01 | 31,44 | 38,20% | 1,24% |
|
ditto excl.sustainable,
incl. wind |
11,53 | 11,53 | 31,44 | 36,68% | 1,24% |
|
ditto, excl.decentral
combined heat/electr. |
8,15 | 8,15 | 19,16 | 42,54% | 2,04% |
| power stations+wind | 8,04 | 8,43 | 18,45 | 45,68% | 2,11% |
|
ditto excl.nuclear
+wind |
7,56 | 7,95 | 18,45 | 43,10% | 2,11% |
In the first row, the Total Supply
includes the nett result of import and export. Because the Netherlands was a
nett importer this resulted in electricity without fossil fuel expenditure and
thus a higher overall fuel efficiency. The import only costs money, but that is
not under consideration here.
The second row, national production
eliminates import, but includes the (“non-wind”) sustainable component. This
sustainable component is probably not required to adapt to wind fluctuations.
The third row national Production incl wind,
excl sustainable is probably the most desirable mix to adjust to the wind
fluctuations if this could be organized with so many suppliers, each with their
own fluctuating demand. A Smart Grid could help accomplish this.
The fourth row eliminates the decentralized
generation, thus painting the situation where such generation is not
involved in compensating for the wind variability.
The next rows show the large power
stations with and without the single
Dutch nuclear power station. The latter has not been required to help out
against the wind variations. It remains at full power as long as the
electricity demand in the country is larger than the so called 'must-run'
level10. This power station
increases the pseudo fossil fuel efficiency of all large power stations incl.
wind with ± 2,6 %. The turning point is hardly affected.
Discussion
These calculations indicate how small the overall efficiency decrease of conventional electricity production needs to be to reach the point where no fuel is saved or CO2 emission reduced in the case when these conventional power stations are required to compensate wind electricity variability. Obviously, wind variability can be larger than that required to reach the turning point and in such a case wind energy leads to increased fossil fuel use and CO2 emission.
Let us also bear in mind that the building, erection and maintenance of wind turbines requires fossil fuel as well. The turbine steel and other material and the (concrete) foundation require energy for their manufacture. A wind farm requires a conventional power station with a power equal to the maximum power of the wind farm. A wind farm with a 25% duty factor requires a back up station with four times the power of that belonging to the actual electricity produced by the wind farm. A critical analysis of the pay back time of the wind farm fully accounting for all fossil fuel expenditure in its manufacture, operation, maintenance and back up requires another study.
Our preliminary estimate, based on data from J. van Oorschot13 shows the energy pay-back time to be minimally 1,5 years. This period is a very optimistic minimum. In this estimate the energy costs for the manufacture of the back up units, the extra high tension grid, transformers and regulating systems etc. The Dutch Gasunie, managing the natural gas distribution grid, announced in December 2009 to plan extra gas pipelines, amongst others because wind energy requires so much extra natural gas. In our estimate we have used the overly optimistic output formula used by the Ministry of Economic Affairs which we have shown here to be wrong. In addition one has to account for the fossil energy costs of maintenance of the turbines, which especially in the case of offshore placement will be significant.
It is quite conceivable that the efficiency reduction of the conventional power systems is not noticed by the operators. Wind electricity has as yet only a tiny contribution in Holland: only some 3,3% of the national electricity production and therefore less than 0,3% of the national energy use. (Do bear in mind that the amount of conventional back up required is about 4 times as large). The wind contribution has grown rather smoothly, and thus the resulting efficiency decrease is also slowly growing. In the period of wind turbine capacity addition conventional installations have probably been replaced by more efficient ones. This may well have masked the negative effect of the wind turbine addition. As an example, dual cycle gas turbines run at almost 60% efficiency, although it takes about one hour before this level is reached. As long as the steam cycle is not operational (i.e. during this hour) these machines run like open cycle gas turbines at 25 to 30% efficiency.
In figure 1 the development of the efficiency of fossil fuel driven power stations is shown for the period 1998 to 2008. The CBS figures for the years 2007 and 2008 are provisional. (There is also a difference between tables, but within one table there is consistency.) It is clear that the efficiency is not a stable quantity. It can only be calculated 'after the fact' and without detailed additional data from the producers the cause of the variation remains unknown.
Figure 1
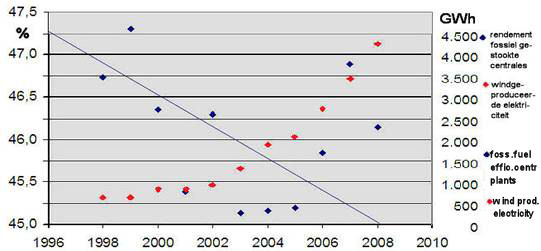
Efficiency of fossil fueled plants &
amount of wind produced electrical energy.
Drawn line represents decreasing efficiency trend,
neglecting the 'not yet corrected' years 2007 & 2008.
In an earlier paper1 we proposed an algorithm to calculate the effect on the overall efficiency of all conventional power stations while only part of the powerstations effectively are required to back up the wind turbines. We start from the equation:
| E = Ew + Ebu + En | (7) |
| (E - Ew) / (R - ΔR) = Ebu / Rbu + En / R | (8) |
| Ebu = aE(1 / b - 1) | (9) |
| En = E - aE - aE(1 / b - 1) | (10) |
| (ΔF = 0 if) Rbu = R(1 - b) | (11) |
In the Netherlands in 2007 a = 4,63%, and we assume b to be 25% .(This is more favourable than in Germany, where the nation-wide value for b was on average over several years about 17%, with variations over the years from 14% to 21 %.) The turning point in Holland is therefore always some 75% of the average 'normal' efficiency factor. The result of the calculations is shown in table 3, where we show the overall efficiency reduction ΔR versus the efficiency of the actual units doing the back up.
Table 3
The efficiency of the units which compensate wind energy fluctuations as a function of the
total efficiency reduction of the conventional units (based on CBS-data for the
Netherlands, 2007). We thank Kent Hawkins12 for his contribution to this table.
|
ΔR (van totaal rendement) |
efficiency back-up units (2007) Rbu |
ditto 2 x as much wind turbines Rbu,2x |
|---|---|---|
| 0,00% | 45,00% | 45,00% |
| 0,50% | 41,77% | 43,40% |
| 1,00% | 38,92% | 41,89% |
| 1,50% | 36,38% | 40,44% |
| 2,00% | 34,10% | 39,06% |
| 2,50% | 32,05% | 37,74% |
| 3,00% | 30,19% | 36,48% |
| 3,50% | 28,50% | 35,28% |
| 4,00% | 26,95% | 34,12% |
| 4,50% | 25,52% | 33,01% |
| 5,00% | 24,21% | 31,95% |
Table 3 demonstrates that at a hardly noticeable efficiency
decrease for the overall system (Small compared to the yearly fluctuations in
this overall efficiency number.) the stations effectively providing the back up
are operating at the indicated reduced efficiencies. In case all back up for wind farms in
Holland would be provided by open cycle gas turbines, having a 25% to 30%
efficiency only (Electricity producer NUON is doing this for its offshore wind
farm), in 2007 we
would have been beyond the turning point. Under the same conditions as in 2007 (same b, same
total of electricity supply, but with twice
the amount of wind electricity and consequently less conventional contribution), the
Rbu threshold would remain ~ 34% and again there would be no saving.
More fuel would be burned
and more CO2 emitted than in the case where no wind was being used.
Pay-back of the energy spent during construction and being spent to run the
extra kit is obviously out of the question.
The conclusion is independent of the wind
contribution: If the wind contribution is n times larger, the turning point
remains at Rbu = 34%.
At 9% wind electricity the power stations held hostage by the wind is already
about ~41% of the total conventional capacity
We have also calculated, using formula (4) how much fuel is saved for the 2007 wind energy production of 0,39 GWyr when using different realistic back up configurations. Figure 2 presents the results, being the fuel saving ΔF as a function of the efficiency decrease ΔR. It is shown that in all configurations the fuel saving turns zero when roughly 2% efficiency is lost due to forced output variations to compensate for wind variability.
Figure 2
ΔF [GWyr]
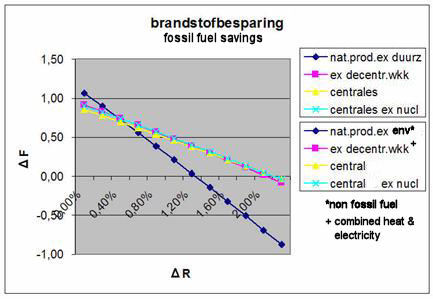
Fossil fuel savings as a function of
decreasing efficiency for different
'back-up' strategies.
Conclusion
The
use of wind energy for electricity generation in combination with the
requirement for fossil fuel powered stations to compensate for wind fluctuations
can easily lead to loss of the expected saving in fuel use and CO2
emission. In addition, the conventional
stations will be subject to accelerated wear and tear.
It is recommended to get an accurate and quantitative insight into these extra effects before
society sets out to apply wind energy on a large scale. Producers must be required
to publish data on the efficiency, the wear effects and the fuel use when
wind energy is added on.
Economical energy storage and buffering methods are an essential prerequisite for large
scale application of wind energy for electricity production.
It is conceivable that the (counter intuitive) use of wind energy in the Netherlands to produce hot
water rather than electricity is to be preferred if one wants to achieve the objective of reduction of fossil
fuel use and CO2 emission.
Nieuwegein/Leidschendam
2010 04 18.
Update-1, note 12.
Update-2, note 7, 2012 04 27.
References & notes.
1 ) K. de Groot & C. le Pair: De brandstofkosten van windenergie; een goed bewaard geheim (The fuel costs of wind energy: a well-kept secret.); SPIL 263 – 264 (2009) p.15 ff.; also on the WWW .
2 ) Senternovem, the R&D agency of the Ministry of Economic Affairs responsible for a.o. Innovation and energy supply, confirmed as follows: (E-mail S. te Buck to S. Zwerver 2010 01 04) “…In this calculation we start from the primary energy requirement which is avoided and therefore we divide by the efficiency of the electricity generation…”. In our symbols: ΔF = Ew / R, as in (2) with ΔR = 0. However, because ΔR ≠ 0, the remarkable consequence of this official calculation method is that it would become possible to eliminate fossil fuel use worldwide by causing the wind turbines in the Netherlands to sufficiently lower the efficiency of conventional power stations. ( R → 0 , ΔF → ∞ ) ☺ .
3) F.Udo: Besparen windmolens CO2? (Do wind turbines save CO2?), Dec. 2009: http://www.groenerekenkamer.com/node/946
4) B. Chr. Ummels: Power system operation with large-scale wind power in liberalised environments; Diss. TU Delft 26 feb 2009.
5) J. Soens: Impact of Wind Energy in a Future Power Grid; Diss. Leuven, 2005 12 05.
6) G. Dijkema, Z. Lukszo, A. Verkooijen, L. de Vries & M. Weijnen: De regelbaarheid van elektriciteitscentrales, een 'quickscan' in opdracht van het Ministerie van Economische Zaken; TU Delft, Fac. Techniek Bestuur & Management i.s.m. DNC, Delft 2009.
7 ) K. Hawkins: Wind Integration: Incremental Emissions from Back-Up Generation Cycling (Part I: A Framework and Calculator). http://www.masterresource.org/2009/11/wind-integration-incremental-emissions-from-back-up-generation-cycling-part-i-a-framework-and-calculator/#comments . Later Hawkins updated his calculator without substantial difference in the outcomes. It can be found via this webpage.
8 ) Katzenstein, W & Jay Apt: Air Emissions due to Wind and Solar Power; Environ.Sci.Technol. 43 (2009) 253-258. They notice among else: "...studies have not accounted for the change in emissions from power sources that must be paired with... such as wind..."
9) http://www.nuon.com/nl/het-bedrijf/kernactiviteiten/opwekken-energie/centrales/cluster-velsen.jsp .
10)
The CBS
uses different units for electrical and fossil energy. In this paper we use a single unit: GWyr.
1 GWyr = 8,76 x 10⁹ kWh = 31,536 1015 Joule
(Ws). 1015Joule is also called petaJoule, PJ. In de
graph, figure 1, we use GWh, with 1GWyr = 8760 GWh.
11) J.C.L. van Cappelle, priv.
comm.: The efficiency of (the Dutch) nuclear plant at full
capacity ( = 515 MWe ) is 37,7%. At 10% capacity reduction this becomes 37,3%. Below
35% capacity the efficiency falls so
rapidly, that power generation is no longer realistic. NB. This is the heat
efficiency, there being virtually no fossil fuel efficiency.
12) Kent Hawkins, Priv.comm. (see note 7)
notified us of an error in table 3 of the previous version of this paper. We
gratefully acknowledge his contribution to the present version of table 3, in
which a third column is now added. We also changed the explanation in the text.
13) J. van Oorschot,
previously dir. R&D and Bus. Dev. Volker Wessels Stevin, priv.
comm.: VWS is involved in the construction and erection of wind farms. His
R&D-department made the following sums: a 3 MW wind turbine requires ~ 400 ton steel
for its frame and ~ 300 ton for the turbine.
Steel costs 8,2 MWh energy per ton. Thus in total 5740 MWh energy. De foundation needs 3000
m3 concrete
(7800 ton). This contains 300 ton cement. Cement manufacture requires 0,5 MWh/ton
energy thus total 150 MWh. Together with steel 5890 MWh. In these
energiesums no acount is taken of
the energy needed for the sand and gravel (dredging), the transportation costs
and the installation costs. VWS estimated total energy requirements to be some
10000 MWh. If the turbine has a ‘duty factor’ of 25% , it will produce 6570 MWh
in one year . Using the simple (wrong) formula this would mean a payback time of 1,5
year. Part of the energy requirements of the manufacture of ‘back-up’
conventional generators, that of the extra grid (in Germany over 2700 km high
tension lines), transformers, here the subsea connectors to England and
Norway etc. have to be added. One also has to subtract the energy requirements of the
maintenance, which will be substantial in
case of off shore operations. We(ClP & KdG) show in this paper that the simple
formula for pay back is much too optimistic. We put the nett electricity yield closer to 0 than to
6570 MWh in one year. Assuming it would
be 2000 MWh in one year, then we are looking at almost 5 year pay back of the
wind turbines themselves.
14) The Minister obtained her results by using graphs in the Delft report (6). Non-linearity was not included in the calculations. Neither was the need incorporated to use low efficiency generators because of the rapid change of wind power. Finally, F. Udo, priv. comm., found a calculation error even in the (too) simple, straight forward, departmental computation.