Wind turbines as a source of electricity*.
by
Dr. Fred Udo
Ir. Kees de Groot
Dr. Kees le Pair
Introduction
Wind turbines are being built in large numbers. In the Netherlands the Government aims facilitating
12 GW wind power in the coming 10 years. Aiming to provide 20% of Dutch electricity from wind, Minister
Verhagen of Economic Affairs, Agriculture and Innovation gave the following response to questions in Parliament:
"In order to realize an increase in renewable electricity (generation) from 9 to 35%
by (the year) 2020 a further growth of wind power on land is necessary as this is a relatively cheap form
of sustainable electricity (generation)."
His answer is similar to that given in many countries. Why is that so?
We can think of 3 main reasons:
-
Subsidizing or otherwise promoting wind energy is an easy and very visible way of showing voters how “green” and sustainable the government is, and how serious it is in combating global warming or as it is now coined: climate change. Wind turbines provide favorite images in any publication on green issues.
-
As long as the total wind turbine capacity is small (say < 5% of total power generating capacity) the negative consequences for conventional power stations are modest and may not even be noticed. The amount of subsidies required and visible impact on the landscape stay below the threshold of public awareness.
-
Large wind-power installation generates a significant subsidy-addicted industry, which will try to sustain itself using a body of professional lobbyists. The latter employ the customary scares of imminent fossil fuel depletion and global warming, nay, climate change.
The results of this development are rather ominous. This article discusses some of these.
1. Installing wind turbines
Building and installation of a wind turbine costs as much energy as it generates in one and a half years.
In addition, wind farms require an extensive infrastructure in the form of cables, transformers and other
equipment for grid access. The Dutch grid management company TenneT calculates that it requires € 4,5 billion
($ 6.4 billion) to connect the planned offshore installations to the power grid. How long will the turbines
have to produce their current to pay back that investment to finally start their intended contribution to
renewable energy?
One should note that the average lifetime of a turbine is 15 to 20 years. Those on the dike near the town
of Lelystad were scrapped after 12 years. The Netherlands Bureau of Statistics (CBS) tells us that in Holland
the average turbine on land yields 22% of the nameplate capacity. This is equal to the turbines running at
full capacity 22% of the time, and standing idle 78% of the time. To extend the lifetime of the bearings the
turbines are kept moving also at low wind speeds, when virtually no electricity is generated.
A horror scenario
The original objective of installing 8 GW offshore and 4 GW onshore has just been changed to 4 GW offshore and
8 GW onshore in view of the excessive costs of offshore wind farms. The government has stated that onshore
wind power is “relatively cheap” (Verhagen, March 2011) A state of the art turbine of 2 to 3 MW has its
turbine at 120 m and a wingspan of over 80 m. Such installations dominate the (flat) Dutch landscape at
distances of as much as 10 kilometers. Turbines have to be installed at distances of at least 10 rotor
diameters from each other, so a turbine requires 0.7 km2 of space.
The required three to four thousand
turbines may make more than 2,000 km2 of land unfit for human habitation.
This is 6% of the Dutch land
surface, one and a half times the surface area of the province of Utrecht, or 90% of Limburg.
The key issue is whether a responsible government can wreak havoc in the landscape and in society in order
to generate less than 10% of our electricity or satisfy between 1 and 2% of our total energy demand. How
many billion Euros will the Minister set aside to compensate for the property devaluation caused by the
wind parks? We fear that the citizen will be the victim.
The turbines need to be positioned in the provinces with most wind: e.g. North Holland, Friesland,
Groningen and Zeeland. Planning of wind energy in Holland is left to the provinces. However, the
provinces of North Holland and Friesland have just decided either to prohibit new wind parks onshore,
or to allow them only in small, designated strips of land (Newspaper Trouw, March 2011.) So luckily
until the arising dispute between government and provincial administrations is settled we will not
have to dwell on the manner in which the turbines would be forced onto the population, with placement
in “Natural Landscapes” (protected areas), ecological exclusion zones, etc.
2. The (un)predictability of wind power
Electricity generation varies with the third power of the wind speed. That means that when wind speed falls
from the level at which the turbine delivers peak power to half that speed, the power produced becomes only 12.5%
of peak power. (Note: Modern turbine blade design compensates somewhat for this effect by allowing for higher
blade efficiency at lower speeds and lower efficiency at top power.)
Therefore the Dutch power producers must know ahead of time what the wind velocity will be in order to compensate
for wind over or under supply by regulating the output of the conventional power stations. ECN researchers have now
concluded that meteorologists can predict wind speed in the next 24 hours within 10% accuracy, after having spent
significant effort on determining this predictability [1]. Improvements are not expected in the short term.
This 10% uncertainty leads to a 30% uncertainty in the forecast of energy production. The grid managing company,
which keeps extra “spinning reserve”, i.e. conventional power plants on standby, takes this uncertainty into account.
The unpredictability of wind costs extra (fossil) fuel. In compensation this company is paid € 0.01 per kWh wind energy
produced. The Dutch government has now decided that this extra cost will be charged to the consumer rather than to the
wind energy producer. In our opinion this amounts to hidden subsidy to the wind industry.
The “spinning reserve” uses mainly or exclusively natural gas, because coal and nuclear power stations are not
able to adjust to the rapid variations in wind. The Dutch Gas grid manager has announced that they need to provide
extra gas pipelines “because the wind costs so much gas”. This does not sound like “sustainability” and “energy saving”.
3. CO2 emission reduction by wind electricity
The wind turbine community does not publicly address the impact of varying wind supply on the efficiency of conventional power plants, although each graph of wind output as a function of time demonstrates the importance of this effect. Here is the graph of wind power feed-in of the 7000 turbines, which the German utility E.ON had in operation in the year 2004.
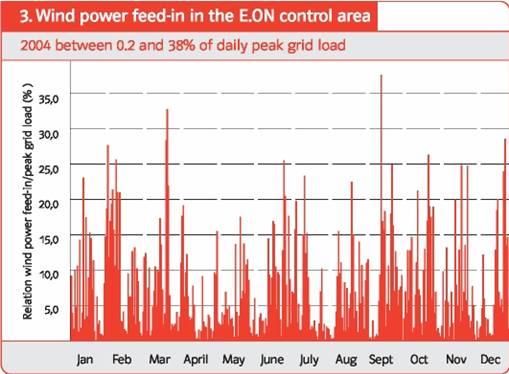
“E.On Windreport 2005”.[3]
These machines are spread out from North Germany to Bavaria in the South. This graph demonstrates that spreading
the turbines over a large area will not eliminate the wind variability. The total daily production of the 7,000
turbines varies between 0.2% and 38% of the daily peak grid load. We conclude that weather systems are larger
than Germany…
Similar evidence has just been provided in the western USA where large variations in output are evident when
looking at total output of turbines over a 300,000 square mile area (778.000 km2)
more than twice the total German territory, which is that much bigger than E.ON’s wind mill spread.[2].
Wind electricity requires conventional power plants to work in spurts. Plant efficiency then falls, an effect
comparable to that of stop-and-go city driving (power plants compensating for erratic wind) when compared to
highway driving (power plants running more steadily). Some wind promoters compare wind turbines, which stand
still 50% of the time, with private cars, standing still 90% of the time. The comparison is false. The car will
move when demand is there, while the turbine only can perform when there is wind. The crucial difference between
“demand-driven” and supply- driven” has either not landed or is not understood in the wind turbine community.
The E.ON graph demonstrates that electricity supply based on a high proportion of wind energy is an illusion.
Wind energy application on any significant scale requires large-scale energy storage. This may only be possible
with hydro-electricity, which cannot work economically in our flat country. For Holland this simply means that
no conventional power station can be closed. It is also clear that even for large spreads of wind turbines the
result is:
No wind means no electricity.
A study for the John Muir Trust by Stuart Young consultancy [4] even puts into question whether the available UK hydro storage can provide the storage required for the present number of wind turbines in the UK. As an aside, it also questions the validity of the five key assertions by the wind turbine industry and governments. Their work is based on analysis of publicly available data, not on model studies.
We will now comment on five discussions of this problem. Two of them are model-based predictions, to find out how much wind energy can be accommodated. The last three use real data to determine the overall net effect of wind electricity addition to the grid.
-
a. Ummels [5] attempts to demonstrate on the basis of model calculations that 20% wind electricity can technically be accommodated in the Netherlands. In the introduction of his thesis he states that this leads to 19 million ton reduction in CO2 emissions, but on page 139 in his thesis he qualifies this conclusion as follows: “These benefits are dependent on fuel prices, the conventional generation mix, electricity consumption, the yearly wind regime, the international market design, interconnection capacity, etc. but are considerable in any case”. Efficiency losses in the conventional power stations are hardly taken into account in his model.
-
b. The thesis of Soens [6] concludes on the basis of model calculations analogous to those of Ummels for the Belgian situation, that accommodation of wind energy beyond 5% of the peak demand is uneconomical. If the situations in both countries would be comparable, we would have reached our quorum in the Netherlands already with the present 2 GWatt capacity.
-
c. We [7] have shown that a modest overall reduction in the efficiency of conventional power stations in response to the need to compensate for wind fluctuations leads to a significant decrease in the amount of CO2 supposedly saved by wind energy. In part 6 we will expand on this statement and introduce the power duration curve.
-
d. The BENTEK Report [8] concludes that the addition of 1 GW wind power in Colorado has resulted in higher rather than lower CO2 emissions. This report is based on actual emission data not on a model study.
-
e. The electricity generation system in Denmark has seen major changes in the last 20 years. The effects have been carefully documented by Energinet [9].
The Danes converted power stations to combined heat and power units, and in addition switched from coal to gas feed in 25% of the cases. Furthermore, some biomass is also used in the coal-fired stations. Finally, they added 20% (of total generating capacity) as wind power in the years 1999 to 2005.
The graph made by Energinet shows the development of CO2 emission per fuel unit and kWh electricity generated.
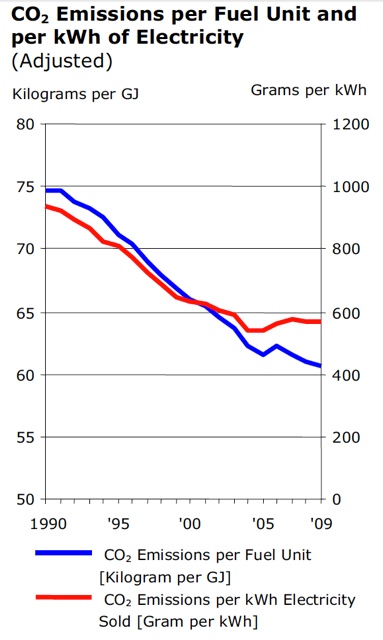
CO2 emission by electricity production 'wind leader' Denmark.
The blue curve shows the CO2 emission per fuel unit employed. The decrease is due to
conversion from coal to gas in the power stations. This curve shows a decrease to 2009.
The red line shows the emission per kWh electricity generated. The red line departs from the blue line as
from 2000: the reduction in emission per kWh lags the reduction per unit of fuel. As from 1999, the Danes have
built massive amounts of wind turbines, and the sum total is that the red curve deviates in the negative sense
from the blue one! If wind energy would save fuel and CO2 emission, the red line would
have to “dive” under the blue line after 1999. The result is the opposite deviation! Actual data (rather than
model studies) from Denmark thus show:
Wind does not save fossil fuel, therefore does not reduce CO2 emissions.
The amount of extra fuel required by conventional units in order to compensate for wind fluctuations varies. It
is dependent on the overall mix of power stations (gas, combined heat and electricity, coal, nuclear, etc.) and
on the policy of the power authorities: do they go for minimal cost, minimal risk, do they prefer a certain fuel
type etc. Strictly speaking the figures for one country or area are not applicable to another. However, the
configurations in Colorado and Texas – largely coal and gas use – are very much like the mix in the Netherlands.
Therefore the BENTEK results are quite relevant in this country. In Belgium more nuclear power is installed,
and thus the situation will be different, as the nuclear stations are used in a “must run” mode. However, the
difference between the two countries is not large enough to explain the different outcomes of the model studies
of Ummels and Soens: Coal fired units do not differ that much from nuclear units in their “must run” properties.
4. How can we fit in the planned amount of wind electricity?
The government target is to have 12 GW wind energy installed before the year 2020, in order to be able to produce
20% of our electricity demand in a “sustainable” manner. The turbines will thus produce 12 GW at peak power. The
total Dutch consumption during the low demand periods is only some 10 GW. That means that when the wind is
blowing at Bft 6 we need to dispose of 2 GW of generated but unwanted electricity.
This is no minor issue, as conventional power stations cannot be stopped without consequences. A “cold start”
when the wind speed decreases, and especially when the demand increases on say Monday morning, takes too long, is
very costly and requires considerable extra fuel. Also remember that the lifetime of a large generator is to a
considerable extent dependant on the number of cold starts. [9]
The so-called “must-run” power level is the lowest power output that must be kept available in the conventional
systems. According to wind energy promoters this level is only a few GW. Power generation experts [9] put this level
at 8 to 10 GW. This means that during the low demand hours must-run and demand are in balance, and that there is no
room for wind energy.
The issue of fitting-in additional power can be treated by using the so-called “power-duration” curves as
developed in the PhD thesis of Ummels [4]. These graphs are based on experimental data. We will review the
technical details in a separate chapter (6). Our conclusion from that chapter is that when 12 GW wind power
is installed in the Netherlands, a full 40% of this wind power cannot be accommodated in the Dutch grid. This
result is given additional credibility by the actual data from Denmark (see below).
Export is still touted as the solution for wind energy oversupply. This argument is not valid: when we have
high winds in Holland, it also blows in the surrounding countries in Western Europe. Such is the nature of our
weather systems.
Let us turn again to the great example for the wind promoters, the Danish situation. The Danes produce 18%
of their electricity by wind, but a full 50% cannot be accommodated locally. This oversupply is exported to Norway
and Sweden, where it is used to replace hydro electricity. For about a year the Scandinavian Power market rewards
electricity oversupply with a negative price of up to € 200 per MWh, or € 0,2 per kWh.
CEPOS, an independent Danish
scientific institute, has issued a report entitled: “Wind energy, the case of Denmark”. The authors are quite
explicitly negative about the practice of supplying free (subsidized) electricity to their Scandinavian neighbors
at times of oversupply, and the purchase of electricity at high cost during periods where the wind cannot deliver.
We quote from page 29:
“The very fact that the wind power system, that has been imposed so expensively upon the consumers, cannot and
does not achieve the simple objectives for which it was built, should be warning the energy establishment, at all
levels, of the considerable gap between aspiration and reality.”
Negative electricity prices are the only way to stop the turbines, but we made it clear that this phenomenon
makes the running of a conventional system virtually impossible. It endangers the overall power generation system,
unless the government (i.e. the citizens) pays additional subsidies to keep the back up systems running.
We note that as from this year in the Netherlands all so-called green electricity subsidies (SDE+ ruling) will
be charged directly to the customer, so that the government is no longer seen to subsidize the “green” sources.
5. Conclusions
From the foregoing it is clear that 20% wind energy cannot be accommodated in our current grid.
Half of this wind-generated electricity cannot be accommodated at all, and the other half will disturb the existing
system to such a degree, that fuel and emission savings will hardly materialize.
If one does want to go for wind energy, one must be patient until such a time that technology allows the
accommodation of large amounts of wind generated electricity. This may once happen, but it requires years of hard work.
6. Appendix: Power-duration curves, the details
Figure 17 from [3] shows the electricity demand variations over a certain week in the year 2007.
Demand curve. (Monday through Sunday)
Such curves have been in use by the grid to balance supply and demand. We now take a full year of such curves, and then look at the total demand over 15 minute periods. This gives 365 x 24 x 4 = 35000 periods of demand. The computer program now searches for the 15-minute interval with the highest demand at puts it on the Y-axis of the graph below.
It then looks for the next highest demand per 15 minutes and plots it next. In this way 35000 demands per
15 minutes are plotted. These form the top curve in the graph. It shows the real demand- duration curve
for the Netherlands. One can see that for 2007 the maximum actual electricity demand was around 20 GW, and
the minimum just below 10 GW.
Next one can obtain the data on wind force per 15-minute interval from the meteorological Institute KNMI.
From this one can calculate the actual wind electricity yields for any desirable total installed capacity.
This wind generated electricity yield (for each relevant 15 minute time slot during the year) can be
subtracted from the demand. Ummels [4] has done this for installed capacities of 2 to 12 GW in 2 GW steps.
The results are depicted in the graph.
We have added a line at the 10 GW level, the “must-run” level as set by the experts for the Netherlands
situation [8]. The amount under the horizontal line is the amount of wind energy that cannot be accommodated
in our grid. With 12 GW wind power installed one could theoretically provide 20% of the required electricity.
However, the power duration curve demonstrates that about half the time there is surplus wind current. The
total surplus amounts to 40% of the supply by wind, a figure remarkably similar to the Danish situation.
The graph also shows that at the current 2 GW installed capacity there are few problems. Let us reiterate
that the power demand curve and the wind data are actual and factual, and not the result of model studies!
Finally, the power duration curves also show that the efficiency loss caused by 20% installed wind
capacity is much larger that the few percent admitted by the wind lobby. The capacity factor of wind
turbines is on average not above 25% (even allowing for presence of a sufficient number of offshore
turbines). Therefore wind electricity is generated by a set of turbines having a capacity of 80% of
the conventional power stations.
The impact of the “20% wind” is thus felt by almost all conventional power stations. Throttling back
the conventional stations is possible, but if the conventional stations have to be ready and operational
(as in case of no wind) switching off is no option. Below a certain minimum power output level the power
stations become instable and are damaged. Admittedly this is dependent on the type of station, but a
power level below 30% of the nominal one is not possible. In the year 2020 , having 12 GW of wind energy
installed, the Dutch conventional stations are forced to work at minimal level during half the year!
Surely this is an undesired consequence of sustainability.
Notes
- * Translated and partly re-edited from the Dutch text "Windmolens als stroombron" by one of us (KdG) May 2011.
- Supply prediction sustainable energy (sic)- part 2 Short-term prognosis of wind power (in Dutch) A.J. Brand en J.K. Kok; ECN publication ECN-C-03-049
-
John Petersen: A reality check for wind power investors, 6-04-2011,
(http://seekingalpha.com/article/262050-a-reality-check-for-wind-power-investors) - E.On: “Windreport 2005” (http://www.eon.de)
- Analysis of UK wind power generation, [period] November 2008 to December 2010, Stuart Young Consultancy, March 2011, John Muir trust, www.jmr.org.
- “Wind integration” Thesis Delft 2008 by B.C. Ummels.
- J.Soens: Impact of wind energy in a future power grid. (2005).PhD Thesis. Katholieke Universiteit Leuven. Faculteit Wetenschappen: Leuven(Heverlee), Belgium. ISBN 90-5682-652-2. 257 pp.
- C. Le Pair en K. De Groot (www.clepair.net/windrendement.html)
- “How less became more: Wind power and unintended consequences in the Colorado energy market” by BENTEK Energy
- “Energistatistik 2009” (www.ens.dk).
- G. Dijkema, Z. Lukszo, A. Verkooijen, L. de Vries & M. Weijnen: De regelbaarheid van elektriciteitscentrales. Een quickscan in opdracht van het Ministerie van Economische Zaken, TU Delft, 20 april 2009 (The controllability of power stations, a quick scan for the Ministry of Economical Affairs)