
Curtailment in the Irish power system.
Fred Udo
Monnickendam, May 1st, 2012; Email: fredudo@xs4all.nl
1. Introduction.
The production of wind energy has no time correlation with the regular pattern
of electricity demand. This leads to mismatches between the available wind
energy and the conventional generation. These mismatches lead to increased fuel
consumption in the conventional system and situations where wind energy cannot
be absorbed in the grid.
The first effect implies, that stated fuel or CO2 savings
by wind energy are not attained[1].
The second effect caused by the stochastic nature of wind receives much less
attention at present. This is wind energy curtailment.
As wind energy has priority in nearly all electricity distribution grids, the
grid operator needs to adapt the conventional production to the level of wind
energy produced. This is impossible in situations of high winds and low demand,
so the windmills have to shut down partially.
This is called wind energy curtailment.
This effect starts to show at wind penetrations around 10%, if the grid in
question does not dispose of a significant amount of energy storage. Presently
pumped hydro stations are the only economically viable means for utility-scale
storage of electricity. The flexibility of the conventional system plays an
important role as well.
In Danmark one has installed 3 GW wind energy capacity and in parallel all
conventional generators have been transformed in combined heat and power units.
(CHP). This implies, that in winter the running of the generators is largely
determined by the heat demand. P.F. Bach has shown, that Danmark has to export
nearly all of its wind power to Norway during the winter [2].
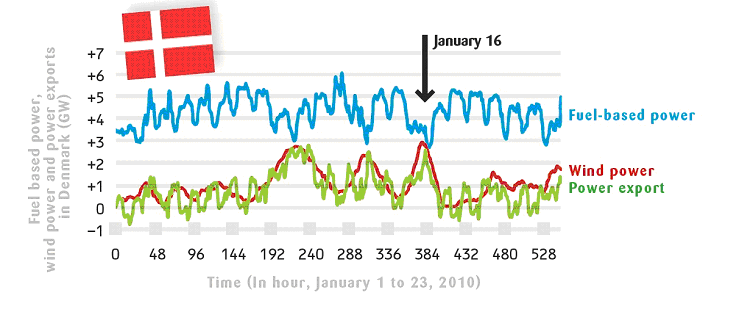
Figure 1, taken from P.F. Bach [2].
Figure 1 taken from ref. 2 illustrates clearly the correlation between
electricity export and wind energy production. The wind production is 20% of
the total demand averaged over a year, but less
than half of it is absorbed in the Danish grid [3].
Curtailment reduces the profits of the wind turbine owners, if they do not get
compensation for the forced stopping of the mills at high winds and low demand.
In England the compensation is really generous, so nobody in the wind industry
cares about curtailment, because it is the rate payer who has to foot the bill
for stopping windmills to produce excess energy.
These generous compensations do not exist in Ireland, so there a hot debate is
raging over the distribution of the burden [4].
The peak demand in the Irish grid is between 3 and 4 GW and the low demand is
between 1.8 GW and 2 GW. The conventional generation has a capacity of 6.7 GW,
so even without wind there is a significant over capacity. An important element
is the adaptation possibility of the Irish grid by the presence of 200 MW
hydropower and 270 MW pumped hydro power.
Recently 1,6 GW wind capacity was added to the grid, while the government
announced plans to increase the wind energy capacity threefold before 2020.
This article discusses some consequences of this transformation of the Irish
electricity supply.
2. Analysis of the 2011 data.
Eirgrid is publishing operational data every quarter of an hour, whichwere
analyzed for curtailment of wind energy. The data were used to create a plot of
total demand and produced wind energy in MW during November 2011. Close
inspection of the wind curve shows frequent dips in the wind production
occurring during times of low demand.
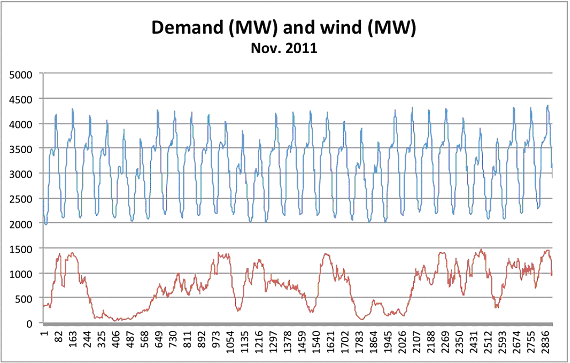
Figure 2. Demand and wind energy production as a function of time in units of ¼ hour.
Curtailment occurs mainly at periods of low demand, so we rearrange the 2880 data points of wind production and total demand in order of decreasing demand.
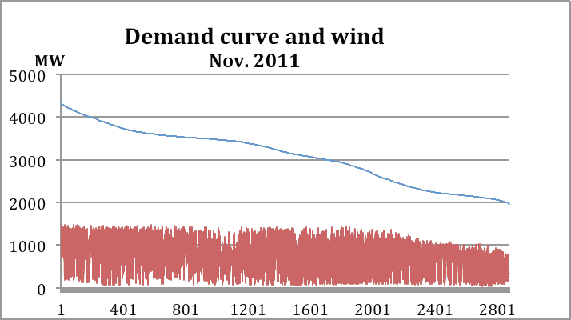
Figure 3. The data points of figure 2 arranged in order of decreasing demand.
The curve of decreasing demand is correlated with the time of the day, as high demands occur during the day and low demands occur during the night. The upper curve starts at 4300 MW, a daytime point of highest demand, and runs down to 2000 MW some time during a weekend night in November 2011. As wind is uncorrelated with total demand the recorded points of wind production show no structure. One feature is clear however: at low demand the thickness of the red band diminishes and starts to follow the demand curve at a constant distance. This is curtailment and the conclusion from the distance between the demand curve and the band of wind production is, that the operators started to cut into the wind production if the demand for conventional energy became less than about 1300 MW. This 1300 MW is the “must run” production in the Irish power grid. This “must run” production is well below the minimum demand in the system, which is around 1800 MW. It is clear, that the amount of curtailment is critically dependent on the “must run” power level of the conventional system compared to the minimum total demand.
In the following discussion we use average production instead of total
production as the numbers for different periods of time can thus be compared
without adjustment.
The curtailment can be quantified in the following way:
Figure 3 shows, that there is little or no curtailment in the first half of the
demand curve. The average wind production is calculated at 815 MW from the first
1500 points.
We assume, that this number contains no curtailment although we have no proof of
this assumption.
Next the average wind production is calculated at 736 MW over all 2880 points.
The difference 815 - 736 =79 MW is an indication of the curtailment in November
2011.
This calculation neglects a possible day/night effect in the wind energy production. The points of lowest demand occur always during the night, so a day/night variation of the wind force could cause a similar effect.This objection can be resolved by the real time, ¼ hour wind energy production forecasts, which are also published by Eirgrid.
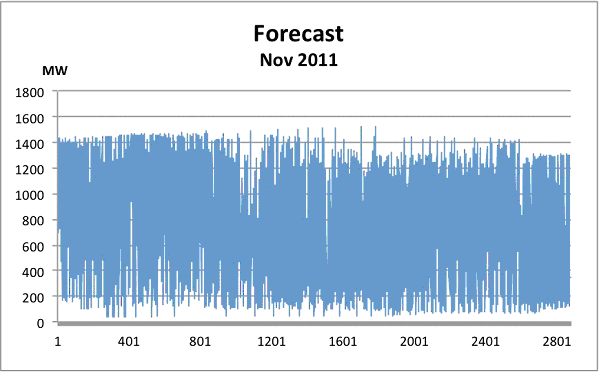
Figure 4. The wind production forecasts arranged as in figure 3.
The characteristic dip visible in the wind recording of figure 2 is absent, but the numbers show indeed a day/night effect:
| Wind MW | FC MW | |
|---|---|---|
| Total | 736 | 755 |
| < 1500 | 815 | 815 |
There is indeed a day/night effect, so the curtailment reduces from 86 MW to
(755 – 736) = 19 MW.
This amounts to 2,7% of the average wind energy production.
We noted before, that the curtailment is extremely sensitive to the amount of
must run production compared to the minimum demand. We increased artificially
the must run production to 1900 MW.
The curtailment rose from 2,7% to 17%.
This number varies from month to month, due to the changing nature of the wind
and because the composition of the conventional generation is not constant.
Hydropower makes a grid much more flexible, so the required minimum of
conventional generation might vary.
This implies, that although the calculation is straightforward without any
assumptions, the results are different from month to month.
The results for the year 2011 are calculated by taking the average over the 12
months.
The data is presented in the following table:
| Wind MW | FC MW | curtailment | |
|---|---|---|---|
| 1-2880 | 484 | 497 | 2,7% |
| < 2000 | 505 | 504 | |
| < 1500 | 511 | 511 |
The forecast predicts 497 MW in case of no curtailment, so the curtailment is: 497 – 484 = 13 MW Figure 4 illustrates the procedure.
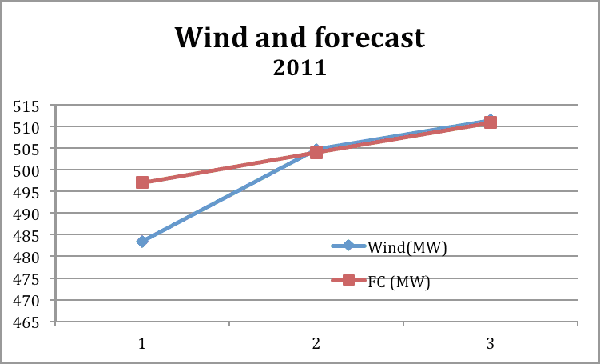
Figure 5. Wind production and forecast.
Figure 4 shows the points. Point 1 are all 2880 points, point 2 are the points 1 to 2000 and 3 are the points 1 – 1500. The forecast is normalized to the data at point 3.
3. The consequences of tripling the wind energy.
The wind curtailment in 2011 was small, but the Irish government announced plans
to triple the production of wind energy towards the year 2020. This would
increase the wind contribution to 50%.
If this plan is realised, there will be certainly not much room for investments
in the conventional generation in the coming years, so we assume, that the
conventional capacity will remain the same.
Tripling the wind capacity is simply simulated by multiplying all wind
production numbers by three.
The exercise with the original wind data has learned us, that the “must run”
capacity is 1300 MW, so we need to cut all wind energy, that exceeds the limit:
This procedure guarantees the “must run” margin for the conventional system. Figure 6 illustrates the result of the procedure. The red band follows the demand curve now everywhere at a distance of 1300 MW, so the curtailment occurs now during all times of the day, even at peak demands.
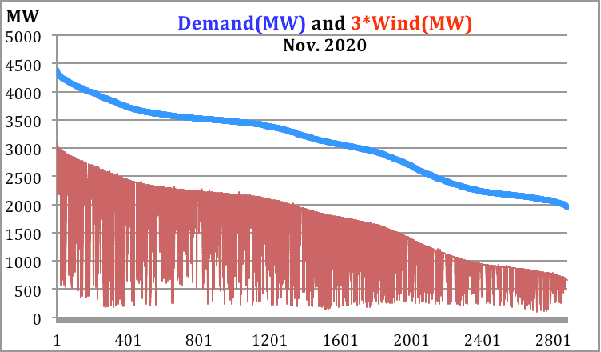
Figure 6. Demand and wind.
We take the original average value for the wind energy production and multiply
this number by 3 to arrive at an expected wind contribution. We compare this
number to the average wind production in the curtailed situation.
This procedure is also done for 2 times the present wind capacity.
The result for the data of 2011 is depicted in figure 7:
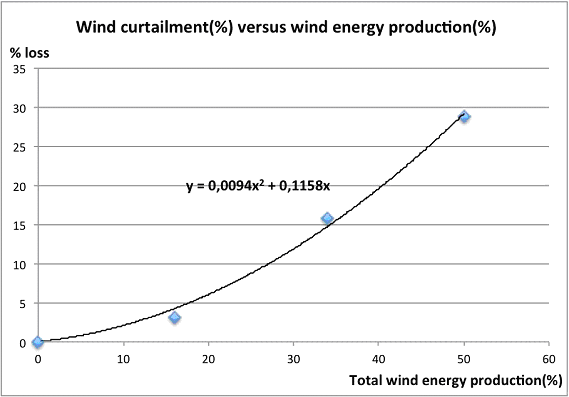
Figure 7. Curtailment.
Figure 7 shows the wind energy curtailment loss as a function of the expected wind contribution.
The data of figure 6 tell something about the influence of the wind on the running of the conventional generators. Figure 6 presents the case of 50% intended wind, but figure 7 tells us that the real contribution is not more than 35% because 1/3 of the wind energy cannot be absorbed in the grid. One can also derive from the data of figure 6, that the conventional generators are pressed to deliver not more than 1500 MW during 47% of the total time. The lower edge of the red band indicates that during a large part of the time not more than 200 MW wind is available. This implies, that at least 4 GW conventional capacity should be standby to cope with these minima, but at the same time these generators are not allowed to produce more than 1500 MW.
Modern CCGT units are advocated as the ideal backup generators for wind energy. One has to realise, that the recommended operating range of a modern 59% efficient CCGT unit is between 60% and 100% of its maximum power output [5]. At power levels lower than 60% of the maximum the efficiency lowers nearly linearly with the power level, This implies, that the must run power level needs to be adjusted to this requirement and the curtailment will be above the levels calculated from the simple extrapolation presented here. Reference 1 shows, that the efficiency of the Irish wind energy production is seriously affected at present levels of wind penetration, so it will be disastrous at three times the actual wind energy contribution.
4. Conclusion.
This analysis shows, that wind contributions above 20% become very unpractical
even in Ireland.
A wind capacity, that is built to deliver 50% of the Irish demand for
electricity, will in reality only contribute 35% to the total production.
It should be noted, that in extrapolating from the present situation we have
neglected any grid congestion issues, which undoubtedly will occur. Even with a
considerable grid expansion our curtailment figures should be considered as
minimum values. Even if the grid were reinforced sufficiently to solve
congestion, one still will have to live with a 30% loss of wind energy through
curtailment.
A second remark is that the Irish grid is very flexible due to the near absence
of CHP installations and the presence of 470 MW of hydropower. Other grids
(England, Holland, Germany, Danmark) have much less flexibility, thus the
curtailment losses will be much higher.
The experience in Danmark shows, that already at 20% wind energy penetration,
export is the only way to get rid of half the wind energy. This solution is
unique to Danmark as all other countries in NW Europe will be surrounded by
windmills of their neighbors.
May 1st, 2012
Revised: May 5th, 2012.
Notes.