DEVASTATING TIPPING POINTS
THROUGH DIFFERENCES
IN EXPONENTIAL GROWTH.

by
C. le Pair
clepair@casema.nl


Abstract

Exponential growth or compound interest may easily generate astronomic numbers. Which lead to impossibilities in a limited domain. This paper shows, how also differences in exponential growth can lead to unexpected socially disastrous situations. A plausible example of such a growth of wealth, lasting centuries and bringing prosperity to mankind as a whole is modelled. It shows how a gently proceeding generally appreciated process brings on a catastrophe as a result of a mathematically unavoidable tipping point phenomenon.
Sad to say that the presented model seems to fit society's current course.


Introduction

An old anecdote tells about the chess inventor charming an Indian Radjah with his new game. The enchanted Radjah wanted to reward him generously. "Tell me what you want and you'll get it." The inventor grinned and asked just one grain of rice on the first of the 64 squares of his chess board and subsequently every time double the previous amount on the next square. The Radjah soon learnt that there would not be enough rice in the whole world to keep his promise.

Bankers and loan sharks in the Middle Ages knew already that a compound interest rate of only a few percent would generate tremendous wealth (or debt) over a long period of time. A rate of 2% p.a. would in 35 years double a capital or a debt. In a formula a capital of 10 dollar against a compound interest of 2% in x year would grow to an amount A dollar as

A = 10 * 1,02x

In the seventies of last century The Club of Rome, a group of influential rich people, contracted some scientists, to report about what this simple formula and the Radjah's lesson would mean for mankind in a world endowed with limited resources. The result appeared as a report(1) "The Limits to Growth". It was widely discussed and its warning became general public knowledge. It is in fact nothing more than a substantiation of the ancient wisdom: "what is lost and not suppleted" becomes less".

Soon after its appearance critics showed that the timing in the report did not comply with events in the real world, but its overall message apart from the timing is irreputable. New techniques and new discoveries falsifying the conclusions of the report did only postpone most of the doomsday messages. And showed: there is enough time to change some of our behaviors, to make the warnings irrelevant.

I shall not elaborate on those behavioural changes here. But to me it is obvious that we should reduce the use of some finite natural resources and aim for a gradual reduction of the human population. But I emphasise that we have time enough to do it slowly and in a humane way. There is no emergency. The rules of the game should be: honest, good science based advice and education; not enforcement.

The theme of the present paper I presented earlier in a web page in Dutch, which should rather be named a draft note(2). Therin the 'tipping point' consequence of differences between exponential growth rates was shown. I used a primitive model using intuitive parameters of growth rates of wealth in an arbitrary fixed set of people. Because this note and its result caused some noise and comments among a small group of colleagues, whom I sent it to, and I was myself surprised about the agreement with some phenomena currently publicly discussed, I looked for some confirmation or rejection about my parameter assumptions. These I found in the study of Thomas Piketty c.s. published in his book 'Capital in the 21st century(3)'.
According to the New York Times it is probably the most important book of the year in 2014. Together with an accompanying website it contains a wealth of worldwide economic and demographic data over centuries. The data presented are the work of a multitude of authors and investigators in many countries and over numerous years. I consider it a treasure trove for anyone interested in the distribution of wealth in the widest sense. The book requires rather advanced knowledge of economic terms and processes to be fully understood. Such is way above my capacities. In the next section I shall explain in what way I made use of it.


The model in a growing population

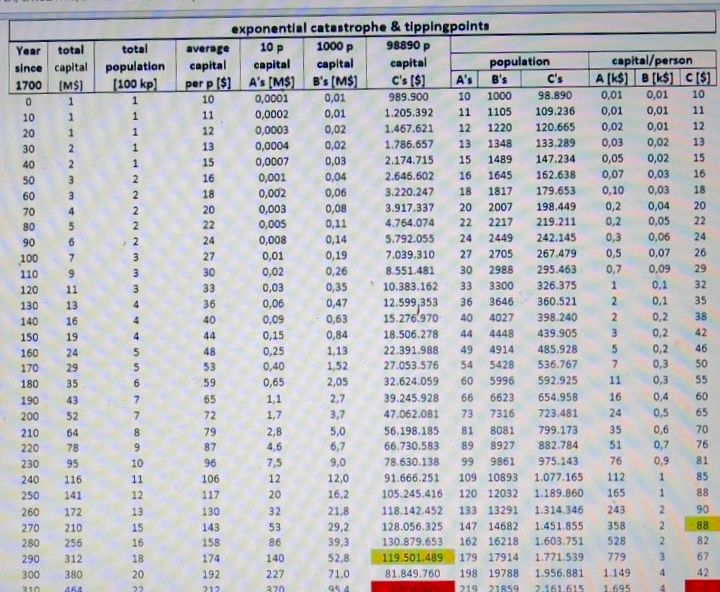
My model consists of a set of 100.000 people(4) and their wealth at the start in the year 1700. I had in mind the city of Amsterdam and some nearby towns, home to the Board members of the VOC (the United East Inda Company) in an era generally considered as the beginning of financial capitalism.
Any other number of people and their wealth at the start would change head counts and wealth proportionally, but not the timing of events. Timing depends on growth rates and the initial number ratios to one another. The set is followed over about three centuries. (In the previous scratch note(2) I used a fixed set.) I learned from Piketty that the demographic development may not be neglected. It also affects the timing of events and the distribution of wealth.
Demographic evolution varies over time and regions. The same is true for the accompanying capitals, In some regions and certain periods the population diminished or grew at a tremendous rate of 4% p.a.. In the new model the growth trend of the population is 1% p.a.. This resembles the average proxy estimates of the whole world from around the year 1000. (Piketty, with some hesitation mentions 0,8% - 1%) .
Also the wealth evolution and its distribution varies between periods and regions. The model's common wealth grows 2% p.a..
The population is subdivided in three groups, A, B and C. At the start the A-group consists of 10 p, the B-group of 1000 p and the C-group of 98.990 p.
In the start year all people own the same wealth, 10 $ each. (In Amsterdam in 1700 this equality was certainly not the reality. In a later paragraph I shall say something about the $ as yardstick. )
The whole population works for its daily needs and to create reserves (more security in the future). The A-group values security more than the others. They know that wealth attracts wealth and they reinvest. Therefore their wealth grows 5% p.a..
The B-group knows the same, but saves a little less. So its wealth grows 3% p.a.. When security is no longer an issue, these growth ranges remain the same. Due to the fact that wealth offers power over others. This brings an advance, when negotiating trade agreements.
The C-group does not care enough about its future security to use their earnings for saving. It is content with its share in the growing common wealth; i.e. the total capital less the A- and B-parts.. As is shown in the evolvement of the said parameters in Table 1, this state of affairs is beneficial to the population as a whole. The average wealth of all members of the set is growing during centuries.

Table 1.

<

Evolvement of population and capital owned between the years 1700-2010 without inflation. At het start 100.000 people, Each owns 10 $.
<


This seemingly utopian progress encounters a first light shock after 270 years of pleasant growth. Instead of a 2 $ p.p. capital increment like in the previous 10 years the C-group experiences a 2 $ capital decrease p.p. in 1970. In the light of many fluctuations over the years, the regions and the individuals, this may go unnoticed and not give rise to serious unrest. Unfortunately it is not a fluctuation, but the result of a tipping point phenomenon. And as the table shows the onset of a disastrous trend change. The capital of the Cs, that was build up in period of 270 years. evaporates and turns into a small average debt of 1 $ p.p. for all 2,1 million members of the C-group in the year 2010. A debt that would rapidly deepen in the following very short time.
I shall not expand on the impact of it here. First I want to make a correction on the model.


Revised model

The invention of money facilitated the trade of various products, resources and services tremendously. Its value required anchoring for which in different times and regions different regimes were tried. They varied from shells, salt, metals, like silver and gold and others. The latter two became more or less the international standard.
Manipulators used various tricks to lift the anchor by changing size and relative content of gold in apparently similar coins to fool there trading partners. Alexander the Great attempted to prevent this more or less successful by having his portrait pressed in the coins to certify their content. This worked reasonably well until the invention of paper money. It was introduced as a convenient replacement and worldwide mostly anchored against an amount of gold. Printing however was cheaper than gold digging and offered a new opportunity of counterfeiting or charging future people for products and services acquired today. In this way it was in the beginning sparsely used by governments together with the earlier introduction of trade in government debts. Piketty's meticulous studies of his data treasure made him conclude that from Medieval times till about 1900 this trick of money creation scarcely influenced national wealths and incomes in money terms. So the $-yardstick for measuring capital I used in the model above was pretty well anchored.
As I started my thinking about the rising financial capitalism in Amsterdam around 1700, I used the dollar, called the Dutch dollar in the Americas, a generally used silver coin, when New Amsterdam (later renamed New York) became the main port of international trade in the New World. Its value was about 1,5 guilder.

In 1900 money creation unattached to production growth, generally called inflation, began to influence national economies and individual wealths. Its use and misuse fluctuated strongly over time and regions. Piketty mentions a trend of about 2 % p.a. with a reservation for all those fluctuations.

A monetary instrument mainly in the hands of governments was gradually extended to other realms of society. First by leaving the gold standard, then by liberalisation of banking and insurance regulations till the present day in which money, or rather credit creation, is dominated by private parties through creation and trade in promises and other derivates. This has led to the curious situation where the total of 'money flows' over the globe more than ten times exceed the trade of products, resources and services.
I’ll leave it to economists to explain to which this scarcely regulated money creation will lead.

Economists have been inventive in circumventing the lack of anchor by using a quotient of current capital value and current annual income as a value indicator. This would be a stable and useful way in a situation of a perfect market it seems to me. But nothing is perfect. What does a stable perfect market mean in the trade of an oil refinery, or the purchase of a nuclear power plant? Do such markets have any connection to the market of potatoes or houses? I think not. So it is not a solid anchorage.
In many economic treatises this quotient of capital and income is measured in %, which, of course, is nonsense. Physicists would not make this mistake. Nominator and denominator have different dimensions. The quotient's real dimension is time counted in years. Blurring an important factor in a complex system blurs the understanding of the system as a whole. Piketty, although often using this quotient and measuring it in %, obviously is aware of this. He also mentions it as time. I think negligence of dimensions should be avoided.

The paradoxical consequences of inflation were imprinted in my mind, when my sister and I talked to our father around the year 2000. In 1940 he had bought the house, in which we grew up, for 4000 guilder. We told him he had become rich. The house was then estimated to value more than 200.000 guilder. He roared with laughter about the craziness of economy. To him the house provided still the same roof over his head, the same protection against winter cold, the same space, in short nothing had changed, since he had used all his savings to buy it. So how could its value have increased? The same must be the perception of the owner of an oil refinery, when an informant tells him that the price of consumer products has gone up.

Inflation, the devaluation of the buying power of a currency, does not affect the rich and the poor in the same way. For the rich it may be used as a profit instrument. While for the poor it means a loss of buying power for their $. Rich man A may borrow a sum of money from B to instal a sewage system in his living quarter. When he honestly pays back the nominal sum at the agreed time, B might grind his teeth. That is, when he finds out, that to install a similar system in his quarter, the money he received is just enough to install a similar system in only one half of his quarter. Because prices of labour and materials have gone up. A has increased the value of his property for half the price.
Another relative new phenomenon became: creating credit by issuing promises and other derivatives. It enabled the creator to purchase or build new capital goods, without any significant use of his present wealth.

For this reason, instead of proposing a new currency anchoring standard, which certainly will find other manipulators to profit from, I decided to simply include different trends in the model used above. The C-group will see their assets, cash, money savings, bank accounts, income buying power, steadily reduced by 2% p.a. after 1900. While the Bs will profit from the new opportunities to create credit and profit from borrowed money by adding 1 % to their capital growth rate. For the A-group the new opportunities offered by inflation and borrowing plus credit-creation increases also by 1 % p.a.. The result of liberalisation and inflation is incorporated in the capital and demographic evolvement in Table 2.

Table 2


Evolution of people and capital after the introduction of inflation and the subsequent start of liberalisation of credit creation after the year 1900. The wealth of the C-group dwindles immediately from 1900 on. Though it is still six times higher than in the 17 hundreds. In 1980 however, the average C has lost all possessions and even owes a debt to the As and Bs of 1,5 $ p.p.. After that year the debt increases at an accelerated pace growing to 167 $ p.p. in 2050.


The revised model does not protect the B-group. Their fate is sealed, but only becomes sensible in the second half of the 21st century. Such model extrapolations are meaningless. Unless you suppose "circumstances unchanged". A more relevant question is, to what extend does the model and its parameters fit the historical data? Piketty's database and his analysis do not correspond to the same segment of society. In the model the dominant group consists of 0,01% of the population. Most of Piketty's inequality data are from a time in which the top 10% in terms of capital or annual income enjoys a substantial part of the national income and wealth.
In part III of the book he explicitly mentions persons like Bill Gates (and I think implying the same like Musk, Buffet, Soros, Fink, Rockefeller and their kind) as singularities. Throughout his work he warns against the assumed precision of the income and wealth data, especially of the very top.

He concludes from his sources that many data on the distribution of wealth and of income show strong fluctuations in regions and in relative short time windows (a few years to a few decennia). His more detailed analysis of France and the US show that such fluctuations, exceeding national or world trend changes, are caused by short living perceptions of what is just and which differences are acceptable or serve the common good in separate societies. Societies with continuing long term inequality, like periods of slavery, serfs, untouchables and such could only persist through extreme means of repression. For such a perverse ideology about the supernatural origine of a ruling elite or other ideologies are a necessity. A strong belief in external enemies or in natural disasters, against which the existing elite supposedly protects the have nots also in some periods did the trick. Beliefs and ethical ideals are cultural phenomena. They may be strongly influenced by a few individuals, or a well organised limited clan.

Piketty also warns in several chapters, about the unreliability of data about wealth and income especially among the super-rich. This is due to their extensive means of tax evasion, legal and illegal, and the spread of their income and wealth over regions. This uncertainty makes a rigorous check on the assumed parameters of long term trends in the model a mission impossible.


Additional reflections

The final phase in the revised model, however, in which the whole population will be in debt to the happy few, meaning a period of major inequality is certainly no chimera. The World Economic Forum, an influential group of the super-rich sees it coming and does not keep it a secret. Less known to the public at large is their ongoing progress in parachuting their cronies and vassals everywhere in influential positions in order to set up a global control system, which supersedes everything the world has ever seen. They clearly anticipate the likelihood that the new serfdom will not be welcomed everywhere without resistance.
The Netherlands is a forefront of the movement. Several cabinet ministers and even the queen are regulars in Davos, the Forum's headquarters. Whole contingents of 'civil servants' have been sent there to attend lectures and receive instructions on what to do to protect the A's profitable process.
Their behind the screen takeover of the financial world is also less well known. It involves banking and banks of banks just as investment companies.
The same public ignorance persists about the Forum's contribution to the creation of a sentiment of fear about forthcoming natural and manmade disasters; such as climate change, epidemics, depletion of natural resources, Nitrogen, CO2 etc.. It all serves the age old wisdom of 'devida et empera'. (divide and conquer). The instrument of doing it, is their newly acquired grip on the worldwide communication system. Reading, seeing and hearing the same messages and comments - often literal translations - about alleged or predicted disasters almost daily in leading media like Le Monde, The Neue Züricher, the Guardian, the FAZ and numerous other newspapers or broadcasted by radio and TV in a substantial part of the world, would be unbelievable, without such centralised control.
Piketty's in part III several times repeated contemplations about the development of the high incomes of the super-rich emphasise the influence of the dominant ideologies in the regions and time periods. These empirically induced notions explain the eagerness of the A-group in the model to control the mass communication media. No better way exists to influence the current ideologies and so to protect their exorbitant interests.

Whether the presented model is a correct representation of the ongoing course of society, or just a more or less plausible rude caricature, the future will tell.

.

IT IS DOUBTFUL WHETHER THEIR INTEREST IN ARITHMETIC CAUSED THE LORD JEZUS CHRIST TO CHASE THE LOAN SHARKS FROM THE TEMPLE COMPOUND AND THE LORD MOHAMMED TO FORBID HIS FOLLOWERS TO LEVY INTEREST ON LOANS. BUT IT IS CERTAIN THAT PRESENT DAY EARTHLINGS WOULD BE WISE TO PAY ATTENTION TO THEIR LESSONS ON THE SUBJECT.


Cha-am, Thailand
. 2024 01 08.

Notes
  1. The Report of The Club of Rome was presented at international meetings in Moscow and Rio de Janeiro in 1971. Lead authors were Donella Meadows, Dennis Meadows, Jorgen Randers & William Behrens with about 17 others. The analysis was based on Jay Forrester’s book ‘World Dynamics’ (1971).
  2. C. le Pair: Een natuurlijk complot & een echte 'Great Reset'.
  3. Thomas Piketty: Capital in the 21st century. Dutch translation; Amsterdam 2014, De Bezige Bij. Original: Le Capital au XXIe siècle, Éditions du Seuil, Paris France 2013. With its online data appendix.
  4. Throughout this paper I use the following notations:
    4.1 decimal comma, i.e. 0,1 = 1/10
    4.2 mil point, i.e. 100.000 = 100000
    4.3 kilo =1000 like in 1 k$ = 1000 $, kp. = 1000 people.
    4.4 Mega (million), i.e. 1 M$ = 1.000.000 $ (106)
    4.5 milliard, Giga, i.e. 1 G$ = 1.000.000.000 $ ( 109). Others write often billion, which I use for million2 = 1012.
    4.6 abbreviations: p.a. = per year; p.p. = per person.
→ top → index