A NOVEL EARTH'S THERMOMETER


EEN NIEUWE AARDSE THERMOMETER


Samenvatting

De verandering van de temperatuur van de aarde kan worden bepaald door de oceaan te gebruiken als thermometer. Na correctie voor de veranderende watermassa levert de methode waarden voor de temperatuurverandering binnen de grenzen van het redelijke. ΔT tussen 0,06 en 0,41 °C/eeuw. ARGO gegevens en 'big data' kunnen de precisie vergroten.

Intro
De bekendste thermometer is een bolletje gevuld met vloeistof verbonden met een capillair (een dun doorzichtig buisje). Als de vloeistof warm wordt, zet ze meer uit dan het materiaal van het bolletje. Dan stijgt het niveau in de capillair.
De aarde, nu ja het dunne schilletje van de aarde, waarin wij wonen ( lucht, grond en water ) is zelf een thermometer. 70% van die schil bestaat uit water, de oceanen. Als die warm worden, zet het water uit. Helaas zit daar geen capillair op, om de uitzetting zichtbaar te maken. Maar als je heel precies meet, kun je ook zonder capillair zien of het water meer ruimte inneemt en hoeveel meer.
Nauwkeurig meten valt nog niet mee. Sinds 1993 doen we dat met satellieten. Voordien werd er ook al gemeten. Toen vergeleken we de hoogte van zeespiegel met die van het land. Dat gebeurt nog steeds overal ter wereld. Hier is een plaatje van de metingen van Rijkswaterstaat sinds 1900.

Abstract

The change in the temperature of the earth can be determined by using the ocean as a thermometer. After correction for the changing water mass, the method produces values for the temperature change within reasonable limits. ΔT between 0.06 and 0.41 °C/century. ARGO data and 'big data. analyses can increase precision.


Intro
The best-known thermometer is a bulb filled with liquid connected to a capillary (a thin transparent tube). When the liquid warms, it expands more than the material of the bulb. Then the level in the capillary rises.
The earth, at least the thin layer of the earth in which we live ( air, ground, water ) is itself a thermometer. 70% of that shell consists of water, the oceans. When it warms up, the water expands. Unfortunately there is no capillary on its container, to make the expansion visible. But if one measures very precisely, one can also detect without capillary whether the water occupies more space and how much more.
Accurate measuring is not easy. Since 1993 we do that with satellites. Previously, there were other measuremnts. Then we compared the height of the sea level with that of the country. That is still happening all over the world. Here is a picture of the measurements by the Netherlands' Water Bureau since 1900:

Fig. 1

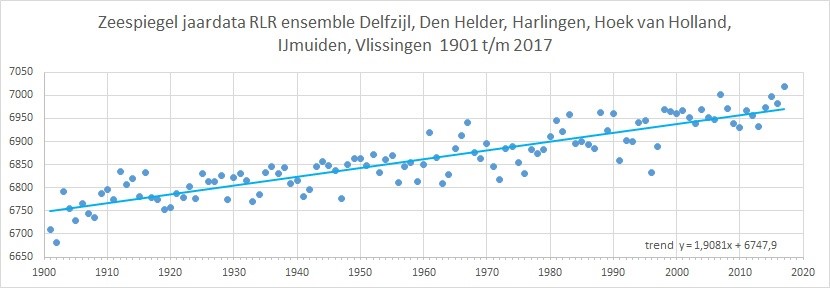
De dienst presenteerde in 2008 een eerdere versie van deze data op zijn webstek vergezeld van de verzuchting dat ze "tot hun spijt" geen snellere stijging konden melden (!). De gemeten trend stijging is ~19 cm/eeuw. Dat is elders anders. In Zweden en Finland daalt de zeespiegel. De Zweden moeten de Noordelijke havens gaan uitbaggeren omdat ze te ondiep worden. De ijzerexport loopt gevaar.
Het komt doordat bij ons de bodem daalt terwijl hij in Scandinavië stijgt. In Finland is die stijging 30 - 90 cm/eeuw (!). Diep onder de grond kantelt een plaat (aardschol), die tijdens de ijstijd door het gewicht van de gletsjer naar beneden was gedrukt en nu 'terug veert'. Dat proces is al 10.000 jaar aan de gang. Op het moment groeit Finland jaarlijks 7 km2.

Bodembeweging is niet de enige oorzaak van ongelijke zeespiegel stijging of daling op verschillende plaatsen. De zwaartekracht, is niet overal precies hetzelfde. Een grote massa zoals een gebergte of een kilometers dikke ijslaag trekt het water een beetje naar zich toe. En als die ijsberg smelt, wordt de aantrekking minder en daalt de 'waterheuvel' in de buurt. Zo smelt de Groenlandse ijskap. Daardoor stijgt wereldwijd het zeeniveau. Maar de zeespiegel in het nabije Reykjavik (IJsland) verandert nauwelijks.
Indien ijs, dat op land rust, smelt en het smeltwater naar zee stroomt, neemt de vloeistofhoeveelheid in de aardse thermometer toe. Daardoor stijgt de watertemperatuur niet - die neemt zelfs af, denk aan een ijsklont die je in je limonade gooit - maar wel het vloeistof niveau.

Samengevat stijgt het zeeniveau op de wereld door uitzetting ten gevolge van opwarming van het water en door smeltend landijs. ( Drijvend ijs heeft geen invloed op de waterhoogte als het smelt. ) Middelen van waarnemingen op allerlei plaatsen en het resultaat van de satellietmetingen leert dat wereldwijd de zeespiegel ongeveer 24 cm/eeuw stijgt. Onderstaand plaatje gebaseerd op IPCC rapport RCP8.5 van omstreeks 2008 toont het aandeel van verschillende contribuanten aan die stijging.

In 2008, the same agency presented an earlier version of these data on its website. It added a sincere excuse. They were sorry not to be able to report a stronger rise of the sea level (!). The measured increase is ~19 cm/century. In other places the rise is not the same. In Sweden and Finland the sea level is falling. The Swedes have to dredge their Northern ports, because they are becoming too shallow. The iron exports are getting in jeopardy.
Their problem is the land is rising, as it is in other parts of Scandinavia. In Finland the lift is 30 - 90 cm/century (!). Deep under the ground a tectonic plate is tilting. During the ice age it was pushed down by the weight of the glacier and now it is 'springing back'. That process has been going on for 10,000 years. At the moment Finland is gaining territory at a rate of about 7 km2 annually.


Earth's internal movement is not the only cause of uneven sea level rise in different places. Gravity is not equal everywhere. A large mass such as a mountain or a kilometers thick layer of ice pulls the water a bit towards it. And when the ice melts and the mass flows away, the attraction decreases and the 'water hill' in the neighborhood sinks. This is why, when the Greenland ice sheet melts, the sea level worldwide rises, but at the same time in nearby Reykjavik (Iceland) it remains virtually unchanged.
When ice on land melts, and meltwater flows to the sea, the amount of liquid in the terrestrial thermometer increases. The temperature of the water does not rise. It drops, think of an ice cube put in your drink. But the level of the liquid goes up.


Summing up, the sea level rises globally by expansion of warming water and by melting of land based ice. (Floating ice does not affect the water level when it melts.) Averaging observations at various places in the world and the result of the satellite measurements indicate a sea level rise of about 24 cm/century. The picture below dated about 2008 based on IPCC report RCP8.5 shows the share of various contributions to the nett resulting rise of the sea globally.

Fig.2


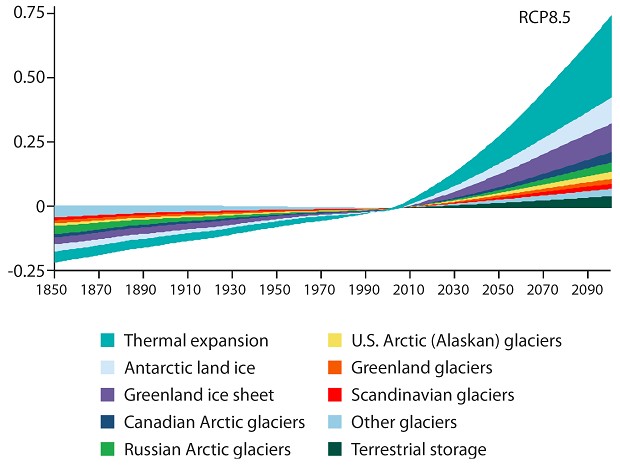
Het is afkomstig van het IPCC (Graph: Figure 9.7 in SWIPA 2017)
Tot 2008 zijn de data afkomstig van metingen. Nadien van IPCC speculatie. Het geloof in toekomstige opwarming en als gevolg ook meer smeltend landijs is sterk, zoals dit plaatje toont. Dat geldt ook voor de Scandinaviërs ondanks hun worsteling met een dalende zee. Zo waarschuwt professor Martin Vermeer (Aalto University Helsinki),in een land dat steeds verder boven het zeeniveau uitrijst: "It is highly likely that will change in the near future. As the atmosphere warms, the sea level will likely continue to rise at accelerating rates. As temperatures go up, the sea level rise will increase further, and even Finland won't be safe after that." Twee maal "likely", eenmaal zelfs "highly".
Ook in Nederland hebben we zulke onruststokers. Bart Verheggen, wetenschappelijk onderzoeker luchtkwaliteit en klimaatverandering, ECN, schreef in het Nederlands tijdschrift voor Natuurkunde (april 2009): "De zeespiegel stijgt nu met ongeveer 3 mm/jaar, ongeveer een factor 10 sneller dan in de afgelopen duizenden jaren. Ook daar slaat Le Pair de plank mis." Dat hij 24 cm/eeuw afrondt tot 30, wil ik hem desnoods vergeven. Maar met die 10 maal sneller zit hij er goed naast, zie het plaatje van het zeeniveau in de afgelopen 20.000 jaar.

It was copied from the IPCC (Graph: Figure 9.7 in SWIPA 2017) (RCP8.5)
Until 2008, the data come from measurements. Afterwards from IPCC speculation. The belief in future warming and, as a result, more melting land ice is strong, as this picture shows. That also applies to the Scandinavians despite their struggle with a falling sea. For example, Professor Martin Vermeer (Aalto University Helsinki) warns - in a country that is constantly rising above sea level - "It is highly likely that will change in the near future. As the atmosphere warms, the sea level will likely continue to rise at accelerating rates. As temperatures go up, the sea level rise will increase further, and Finland will not be safe after that. "Twice" likely ", once even "highly".
We also have such troublemakers in the Netherlands. Bart Verheggen, scientific researcher for air quality and climate change, at ECN, wrote in the Dutch journal of Physics (April 2009): "The sea level now rises by about 3 mm/year, about a factor 10 faster than in the past thousands of years. Le Pair is wrong there." That he rounds off 24 cm/century to 30, I am ready to forgive him if must be. But with those 10 times faster he is quite a mile off. PLease see the picture of the sea level in the past 20,000 years.

Fig.3

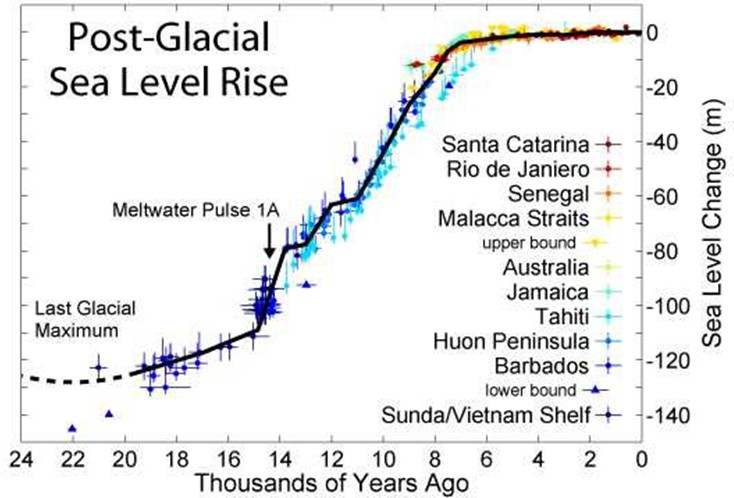
Regeringen van de koraaleilanden in de Grote Oceaan vragen in de Verenigde Naties geld van de rijke landen om de schade te beperken. Het is een inkomstenbron. Met hulp van de Australische regering zijn waarnemingsstations geplaatst. Het resultaat toonde ik eerder al eens. in de passage over zeeniveau. Er is daar geen reden tot zorg; de koralen groeien hard genoeg.

Sinds kort weten we van satellietmetingen dat het oppervlak van de meerderheid van de eilanden zelfs toeneemt. Dat is ook wereldwijd het geval met de zandstranden. A. Luyendijk e.a. schrijven in 'The State of the World's Beaches': "Analysis of the satellite derived shoreline data indicates that 24% of the world's sandy beaches are eroding at rates exceeding 0.5 m/yr, while 28% are accreting and 48% are stable."
Alleen op plaatsen waar mensen actief bezig zijn met werkzaamheden aan de zeekust, verdwijnt systematisch zandstrand.

Indien we de oceaan als thermometer hanteren, moeten we corrigeren voor de toename van de thermometervloeistof door smeltend landijs. Daartoe gebruiken we figuur 2. Al is dat gewaagd, want het betekent aannemen dat het IPCC de metingen aan de gletsjers en de zeehoogte door satellieten niet heeft 'bewerkt'.
Dan is van de opgegeven ~24 cm zeespiegelstijging per eeuw wereldwijd ~5 cm het gevolg van uitzetting en de rest van smelt van landijs. Om daarmee de temperatuurstijging van de zee te berekenen zijn enkele aannames nodig.

  • De gemiddelde oceaan diepte, die deelneemt aan de uitzetting.
  • De gemiddelde oceaan temperatuur van dat deel. (De uitzettingscoëfficiënt van water is temperatuurafhankelijk en de afhankelijkheid is niet lineair. Beneden 4 °C is hij zelfs negatief, anders konden we niet schaatsen.)
  • Zout water heeft iets andere eigenschappen dan zoet. ( Dat verschil verwaarlozen we.)

De toevlucht tot het gebruik van gemiddelden voor de parameters ( diepte van het participerende oceaan deel en uitzettingscoëfficiënt ) in formules is altijd een noodgreep. In feite zouden we voor elke kubieke meter van de oceaan de condities moeten kennen en die integreren. Dat is ondoenlijk. Door gebruik te maken van de ARGO gegevens en met behulp van 'big data' analyse zou vermoedelijk met acceptabele naukeurigheid een bruikbaar resultaat kunnen worden verkregen. ( Ook enige controle op de zeespiegel stijging van 24 cm/eeuw minus 19 cm/eeuw (= 5 cm/eeuw) voor de ijs-smelt is niet overbodig. )
Die gebreken voor lief nemend, is de berekening eenvoudig. Het is niet de bedoeling van dit artikel om even een nauwkeurige waarde van de temperatuurverandering van de oceaan uit te rekenen. Ik wil slechts laten zien dat op deze wijze een aannemelijk resultaat te verkrijgen is, opdat beter toegeruste inderzoeksgroepen misschien de berekening op basis van de ARGO gevens ter hand nemen.

  • D is de gemiddelde diepte van de oceanen
  • A is het oppervlak van de oceanen (onveranderlijk)
  • γ(T) is de uitzettingscoëfficiënt van het water bij temperatuur T
  • < T > is de gemiddelde temperatuur van de oceaan
  • t is de tijd
  • V = D.A is het volume van het zeewater.
  • dD/dt = 0,05 m/eeuw
V(t) = (1 + γ.ΔT)V0

D(t) = (1 + γ.ΔT)D0

dT/dt = 0,05/(γ.D)

De berekening staat in onderstaande tabel voor enkele waarden van de gemiddelde diepte en die van de gemiddelde temperatuur (waarvoor we de bijbehorende waarde van γ gebruiken, die we afleidden uit de waterdichtheid).

Governments of the coral islands in the Pacific Ocean are demanding money from the rich countries in the United Nations to limit the damage. It is a source of income.
Observation stations have been installed with the help of the Australian government. The result I showed earlier in the passage about sea level. There is no cause for concern there; the corals grow fast enough.

Recently we know from satellite measurements that the surface area of the majority of the islands is even increasing. That is also the case worldwide with the sandy beaches. A. Luyendijk et al. Write in 'The State of the World's Beaches': "Analysis of the satellite derived shoreline data indicates that 24% of the world's sandy beaches are eroding at rates of 0.5 m/yr, while 28% are accreting and 48% are stable."
Only in places where people are actively engaged in works on the coastal sea, sand area disappears systematicly.

When we use the ocean as a thermometer, we have to correct for the increase of the thermometer liquid by melting ice. To this end, we use Figure 2. This choice is a bit risky, because it means assuming that the IPCC has not 'edited' the measurement data on the glaciers and the sea level by satellites.
Then of the ~24 cm rise in sea level per century worldwide ~5 cm is the result of expansion and the rest is caused by the melt of land ice. In order to calculate the temperature rise of the sea, a few assumptions are necessary.

  • The average ocean depth raking part in the thermal expansion.
  • The average ocean temperature of that part. (The coefficient of expansion of water is temperature dependent and the dependency is not linear. Below 4 °C γ is even negative, otherwise we could not skate.)
  • Salt water has different properties than sweet water. (That difference we neglect.)

The escape to the use of averages for the parameters ( depth of participating part of the ocean and expansion coefficient) in formulas is always an emergency step. In fact, we should know the conditions for each cubic meter of the ocean and integrate them. That is impossible. By using the ARGO data and by means of 'big data' analysis, a useful result could probably be obtained with acceptable accuracy. ( Also, some control of the sea level rise of 24 cm/century minus 19 cm/century ( = 5 cm/century ) for the ice-melt is not superfluous. ) Keeping these flaws in mind, the calculation is simple straight forward.
It is not the intention of this article to calculate an accurate value of the temperature change of the ocean. I would just like to show that a plausible result can be obtained in this way. So that perhaps better equipped research groups might take up the calculation on the basis of the ARGO data.

  • D is the average depth of the oceans
  • A is the surface area of the oceans (unchanging)
  • γ(T) is the coefficient of expansion of the water at temperature T
  • < T > is the average temperature of the ocean
  • t is the time
  • V = D.A is the volume of seawater.
  • dD/dt = 0.05 m/century
V(t) = (1 + γ.ΔT)V0

D(t) = (1 + γ.ΔT)D0

dT/dt = 0,05/(γ.D)


The table below shows the result of the calculation for some values of the average depth and those of the average temperature (for which the corresponding value of γ we derived from the water density).

T [°C]
average
γ [°C-1] D [m] →
average
1500 2000 2500 3000 3500
16 0,000163 0,20 0,15 0,12 0,10 0,09
18 0,000185 0,18 0,13 0,11 0,09 0,08
20 0,000207 0,16 0,12 0,10 0,08 0,07
22 0,000228 0,15 0,11 0,09 0,07 0,06
24 0,000248 0,13 0,10 0,08 0,07 0,06

Tabel ΔT per eeuw bij 0,05 m/eeuw zeespiegel stijging door thermische expansie.

Table ΔT per century at 0.05 m/century sea level rise bij thermal expansion.

Bij een gemiddelde oceaan diepte: 1500 m < D < 3500 m en een gemiddelde oceaan temperatuur 16 °C < T < 24 °C wijst de aardse thermometer op een temperatuur stijging van de oceaan:

0,06 < ΔT < 0,2 [°C/eeuw].

Indien er minder landijs ijs smelt bij een zelfde zeespiegelstijging, waardoor de bijdrage van de uitzetting van het water niet 0,05 maar 0,1 m/eeuw is, is bij dezelfde grenzen aan de gemiddelde watertemperatuur: 16 & 24 °C en nauwere grenzen van de zeediepte: 1500 & 2500 m de temperatuurstijging:

0,16 < ΔT < 0,41 [°C /eeuw].


Conclusie

De warmtecapaciteit van het deel van de oceaan ( ~700 m ) dat een rol speelt voor het klimaat is groter dan die van de lucht. Weliswaar is het oceaanoppervlak 70% van de aarde als geheel, maar de massa en de soortelijke warmte ( resp. 4186 vs. 1005 J/kK ) maakt de warmtecapaciteit ~200 keer zo groot als die van de atmosfeer.
Gemiddelde temperaturen zijn gebruikelijke termen voor klimaataanduiding. Eerder heb ik al berekend, dat ze tot verkeerde conclusies aanleiding geven.
Maar indien men toch behoefte heeft aan een temperatuurgemiddelde voor de aarde als geheel dan is de temperatuuraanwijzing van de aardse thermometer n.m.m. beter dan die van het arbitrair gedefinieerde 'grid' waarin de aarde is verdeeld voor de bepaling van de gemiddelde oppervlakte temperatuur.
Dat nog afgezien van het feit dat de semi-transparante watermassa energetisch een sterkere wisselwerking heeft met inkomende zonnestraling dan de lucht. En dus meer invloed heeft op het klimaat. Convectie, golven en latente warmte zijn effectieve mechanismen om de oceanische temperatuur over de globe tot ver over land te verspreiden. En zoals ik eerder berekende loopt de temperatuur in een semi-transparant medium hoger op dan in een opake. Niet onbelangrijk wanneer het gaat om de overbrugging van 255 K naar een leefbare wereld.

At an average ocean depth of 1500 m< D <3500 m and an average temperature of 16 °C < T <24 °C, the earthly thermometer indicates a temperature rise of the ocean:

0.06 <ΔT <0.2 [°C/century].


If less land ice is melting by the same sea level rise, causing an expansion of the water of 0.1 m/century in stead of 0.05 m/century, the temperature rise when the average temperature of the water is between 16 & 24 °C and narrower sea depth limits: 1500 & 2500 m will be:

0.16 <ΔT <0.41 [°C/century].


Conclusion

The heat capacity of the part of the ocean (~700 m), that plays a role for the climate, is greater than that of the air. Although the ocean surface area is 70% of the earth as a whole, the mass and the specific heat (4186 vs. 1005 J/kK respectively) makes the heat capacity ~200 times as strong as that of the atmosphere.
Average temperatures are common terms for climate talk. I have already calculated earlier that they give rise to wrong conclusions.
But if one still needs a temperature average for the earth as a whole then the temperature indication of the terrestrial thermometer according to me is better than that of the arbitrarily defined 'grid' in which the earth is divided for the determination of the average surface temperature.
That aside from the fact that the semi-transparent water mass energetically has a stronger interaction with incoming solar radiation than the air. And therefore has more influence on the climate.
Convection, waves and latent heat are effective mechanisms to spread the oceanic temperature over the globe far over land. And as I calculated earlier the temperature rises higher in a semi-transparent medium than in an opaque. Not unimportant when it comes to bridging 255 K to a livable world.


This article appeared simultaneously on
Principia Scientific International.

C. (Kees) le Pair
Cha-am, Thailand
2019 02 11
Thanks to some critical comments by
Karel Wakker, Fred Udo, Djamila le Pair