WINDTURBINES AS YET UNSUITABLE
AS ELECTRICITY PROVIDERS.
C. le Pair, F. Udo & K. de Groot
First published in: europhysicsnews 43 (2012) nr.2, p. 22/5.

Abstract.
We review the effects of the non-demand-driven nature of wind energy on the costs and benefits of large-scale introduction of wind turbines for electricity generation. We demonstrate that the possible absorption of wind energy into the electricity grids is lower than proponents of this energy form claim. In addition, we show that the claimed fuel and emission saved by wind energy developments is mostly significantly less than proposed, and sometimes even absent. Introduction of wind turbines has not allowed the closing of conventional power stations. We conclude that the money spent on subsidizing the large-scale introduction of wind energy can better be spent on energy R&D.
Wind turbines have been widely
accepted as electricity producers thanks to claims that wind comes free of
charge and each kWh thus produced replaces a kWh electricity provided by
conventional techniques, i.e., it saves the fossil fuel otherwise needed.
However, these assumptions have never been validated in existing power
distribution systems even after the installation of as much as 86 GW of wind
power in Europe alone.
The wind energy flux varies
with the third power of the wind speed. Wind energy is only available if the
wind blows strongly enough. This is expressed by saying, that wind energy is
supply driven: it is not available on demand.
This feature makes wind energy
as such unsuitable as a power source for an electricity grid where supply and
demand must be balanced at all times. In order to stabilise the power of the
grid we need either storage or conventional generators as backup. This has
important consequences, as it reduces the fuel savings promised by the wind
industry, while it doubles the costs of the power systems.
An often-heard objection to
this argument is, that by spreading wind turbines over a large area the
fluctuations in wind fields average out. This argument can be quantified by
looking at the correlation length in wind patterns. Rather than discussing
these wind patterns we discuss the production of 7000 wind turbines in Germany.
In 2004 the electricity company E.ON had some 7 GW wind power installed over the whole
territory of Germany. In their ‘Wind report 2005’[1] they published the
wind electricity produced in 2004 on a day-by-day basis (Fig.1).
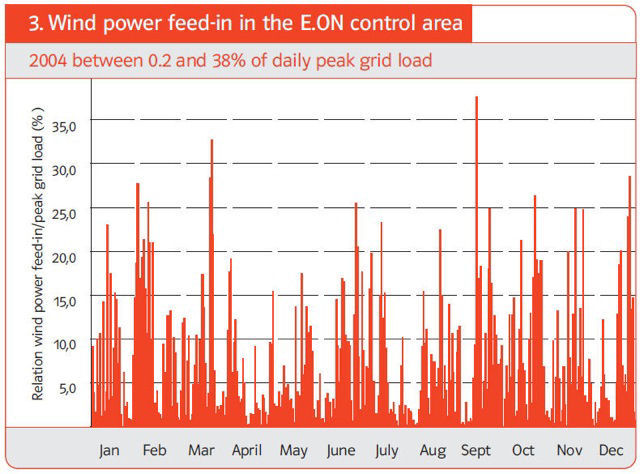
Figure 1. Daily wind electricity contribution.
The conclusion is that on a 24
hour basis the correlation in wind energy production is strong over all of
Germany. This effect has been analysed for the case of Germany by the Aachen University
[2]. The result is,
that the possible substitution of conventional sources by wind is only a few per
cent of the installed wind capacity. This result is in contradiction to the
statement of Eecen et al. [3].
Other studies have shown a
strong correlation between the wind energy production in Denmark, Germany and
Great Britain together. The North Sea is often hailed as the future
powerhouse of Europe, but its opening hours are quite irregular….
This implies, that wind power is
not an alternative for conventional production capacity. The investment in wind
turbines requires extra capital on top of the cost of a conventional system,
which by itself is already capable to satisfy the total demand. Moreover this
extra capacity also requires extra connection lines. In Germany the plans to
install more wind turbines require 4000 km of extra high voltage transmission
lines, which otherwise would not be necessary.
The capacity factor and curtailment
The frequency distribution of
the wind velocity is described by the Weibull distribution, which reveals, that
wind speeds from zero to the average wind force are as frequent as all other
wind speeds together. An average wind speed is typically 6 m/sec onshore. The
average wind force is larger at sea than onshore.
Windmills start producing
electricity at about 5m/sec and reach full power at 13 m/sec.
The capacity factor of a wind
turbine is the fraction of the time it effectively runs at full capacity.
The capacity factors offshore
are about 0,4 and about 0,25 in good locations onshore.
The measured factors are 0,22
for the Netherlands, 0,17 for Germany and 0,24 for Ireland.
This means that a wind energy
system, which has enough capacity to satisfy the demand, covers less than 25%
of the total demand during a year.
Is it possible to absorb such
an amount of wind energy in a conventional system?
Here we follow the
calculations done by B. Ummels [4].
The electricity demand follows
a curve, which is largely the same everywhere in Europe.
Figure 2 represents such a
curve for the weekly demand in the Netherlands in 2007:
Figure 2. Total demand for a week.
Such curves are in
use by the producers to balance supply and demand. Taking a full year of such
curves, we split the total demand in 15-minute periods to arrive at 365 x 24 x
4 = 35040 periods of demand. The computer now sorts the 15-minute intervals
with their demand in decreasing order and puts them on the Y-axis of figure 3. These
points form the top curve in the graph. It shows the so-called demand-duration
curve for the Netherlands. One can see that the maximum electricity demand was
around 20 GW, and the minimum just below 10 GW. Next one can obtain the data on
wind speed per 15-minute interval from the Meteorological Institute. These data
allow calculating the actual wind electricity yields for any desirable total
installed capacity. This wind generated electricity yield (for each relevant 15
minute time slot during the year) can be subtracted from the demand, so the
production of wind energy is now represented as a negative demand.
Ummels [4] has done this for installed capacities of 2 to 12 GW in 2 GW steps.
(see figure 3).
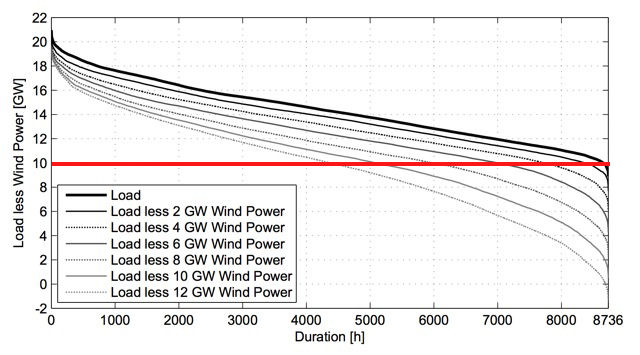
Figure 3. Demand-duration curves in the absence of wind power
(upper curve)
and with the wind power contributions indicated.
The “must run” capacity is defined as the minimum output of a conventional system under the requirement that it can deliver full output on short notice, i.e. during a period of rising demand and falling wind production. The must run output is represented as a horizontal line in figure 3. The height of this line is a subject of debate, but the choice of 10 GW is the result of the following arguments:
- The difficulty of running large installations below 50% of full load.
- Industrial electricity production in combined heat and power installations is beyond control of the electricity distribution network. The same holds for Combined Heat and Power (CHP) installations for district heating.
- Cycling of coal-fuelled generators can lead to unexpected consequences, as detailed in the Bentek report about the Colorado electricity supply [5].
The surface under the horizontal line represents the amount of wind
energy, which cannot be accommodated in the grid. With 12 GW wind power
installed one could theoretically provide 20% of the total demand. However, the
power duration curves demonstrate that about half the time there is surplus
wind power. The total surplus amounts to 40% of the supply by wind. Not only
is a solid 40% of the wind production lost, but also the conventional system
has to run at minimum capacity during exactly half the time.
Export is still touted as the solution for wind energy oversupply. This
argument is not valid because, when we have high winds in one country in
Western Europe, it also blows in the surrounding countries. Such is the nature
of our weather systems.
Let us turn again to the great
example for the wind proponents, i.e. the Danish situation. The Danes produce 20% of
their electricity by wind, but half of that cannot
be accommodated locally. This oversupply is exported to Norway and Sweden,
where it is used to replace hydro electricity. Since 2010 the Scandinavian
Power market rewards electricity oversupply with a negative price of up to €
200 per MWh, or € 0,2 per kWh.
CEPOS, an independent Danish
scientific institute, has issued a report entitled: “Wind energy, the case of
Denmark” [6]. The authors are quite explicitly negative about the practice of supplying free
(subsidized) wind electricity to their Scandinavian neighbours at times of
oversupply, and the purchase of electricity at high cost during periods when
the wind cannot deliver.
We quote from page 29:“The very fact that the wind power system, that has been imposed so expensively
upon the consumers, cannot and does not achieve the simple objectives for which
it was built, should be warning the energy establishment, at all levels, of the
considerable gap between aspiration and reality.”
Negative electricity prices are the only way to stop the turbines, but this
phenomenon endangers the exploitation of the conventional power generation
system, unless the government (i.e. the citizens) pays additional subsidies to
keep the backup systems running.
The saving of fossil fuel
Many studies worldwide
indicate that the fuel saved by wind is far less then proponents assume, [7,8,9].
Most of those studies are
based on models by lack of operational data with two exceptions: The Bentek
report on wind in Colorado and Texas [5] and Udo’s analysis of the operational data of EirGrid [10].
But let us first review the
factors affecting the actual performance of the electricity-generating system
when wind turbines are added.
The widely published argument
in favour of wind energy is:“The conventional units
produce less energy, so they consume less fuel."
Several factors influence this
simple result in a negative sense.
- Conventional units forced to operate at less than optimal power due to supply of wind electricity. As a consequence, they have a lower thermal efficiency. They consume more fuel per kWh compared to the consumption without wind.
- Cycling conventional units – ramping up or down – in response to fluctuating wind contribution uses more fuel than running at constant power.
- Idling of conventional generators synchronous with the grid but not delivering electric power costs 6 – 8% of the fuel required for running at design capacity. This is necessary to step in, at sudden lulls of the wind over wind turbine arrays.
- Extra cold starts of conventional units easily require more fuel than wind developments produce. For example: one cold start of a highly efficient 360 MW CCGT (Combined Cycle Gas Turbine) consumes the fuel equivalent to the electric energy which twenty 3 MW wind turbines produce during 40 hours running on average output.)
- Construction and installation of wind turbines requires a quantity of energy equivalent to about 10% of their life-time production [11].
- Capital costs and energy involved in connecting wind turbine parks to the grid, including adaption and transforming, have to be added to the wind park costs and subtracted from yields [12].
- Self-consumption of electric energy by wind turbines and their electronics while idling and at rest, i.e. heating during cold periods and electricity consumed by the power electronics for grid adaption[13].
- Increased use of inefficient, fast ramping OCGTs (Open Cycle Gas Turbines) instead of twice as efficient CCGTs to meet sudden wind variations.
- Energy costs related to extra wear and tear of conventional units due to frequent forced ramping in response to the wind variations.
The Bentek study used the
actual exhaust data of CO2 and other gases before and after the
introduction of wind developments. The authors corrected for import and export,
change in demand and other relevant factors. The conclusion is: wind does not
save fuel and does not reduce emissions in Colorado and Texas.
Udo’s review of the actual
Irish data revealed, that a 12% wind contribution in the Irish grid system
without large-scale storage resulted in a fuel saving of 5%.
In the Bentek research the
factors 5, 6 & 9 are not taken into account. The inclusion of 7 is dubious.
In the EirGrid data, the basis
of Udo’s analysis, the factors 4, 5, 6 & 9 weere not taken into account. The
inclusion of 3 and 7 is uncertain.
The cost of wind energy
In the article of Eecen et al. [3] two claims are made about the costs of wind energy:
- "The cost of onshore
wind energy reaches the cost of fossil energy…”
Our comments are the following:- The product of a windmill is supply driven, so it does not have the same value as conventional electricity. Formerly this was partly expressed by the imposition of imbalance costs on the producers of wind energy. These costs are now paid by the consumers. Experts estimate the true value of wind energy between 1 and 3 cents per kWh [14].
- The interest rates have been exceptionally low in the last years, while the dominant part of the cost of wind energy is capital. This partly explains the recent decrease in cost of onshore wind energy.
- The environmental costs are omitted in the price of onshore
wind.
Land occupation: The distance
between turbines of a wind-farm must be large due to the wake effects described
in ref. [3]. The result is, that the capacity density cannot be more than 9 MW/km2,
so 9 GW wind capacity will occupy around 1000 km2
of land-area. This territory will be unfit for human occupation because of
continuous noise and flicker effects.
Lowering of estate values. Surveys have shown, that houses within sight of wind-parks lose an appreciable percentage of their value. In highly populated areas this depreciation is larger, than the amount of capital invested in wind turbines.
- “…it is expected that the relatively young offshore wind
technology will experience a strong learning curve, leading to significant cost
reductions"
We note: From 2005 to 2010 the price of installing offshore wind farms has increased from 2 million euro/MW to 4 million euro/MW [15]. This is a strong learning curve indeed.
Conclusion
Quantifying the
decrease in efficiency of the electric power system and the extra fuel
consumption induced by wind developments is by no means a simple matter. To our
knowledge there are presently not sufficient data in the public domain to
substantiate a definite answer to the question how much fuel and CO2
emission is saved. It depends on the actors, the equipment, the kind of fuel,
the amount of wind penetration, the behaviour of the regional wind, the amount
of storage, the interconnection of regional grids etc.
Decisions to install large-scale
wind powered electricity generation are based more on the expectation to save
significant amounts of fossil fuel and CO2 emission than on any
evidence that this is indeed the case.
Wind technology is not suited
for large-scale application without a good buffer and storage system. We
propose to stop spending public money on large-scale use of wind. This money
should be spent on R&D of future power systems. We expect, that wind will
not play an important role in these future systems.
References.
C. le Pair & K. de Groot:
The impact of wind generated electricity on fossil fuel consumption; Note 13.
![]()
![]()